Fig. 11
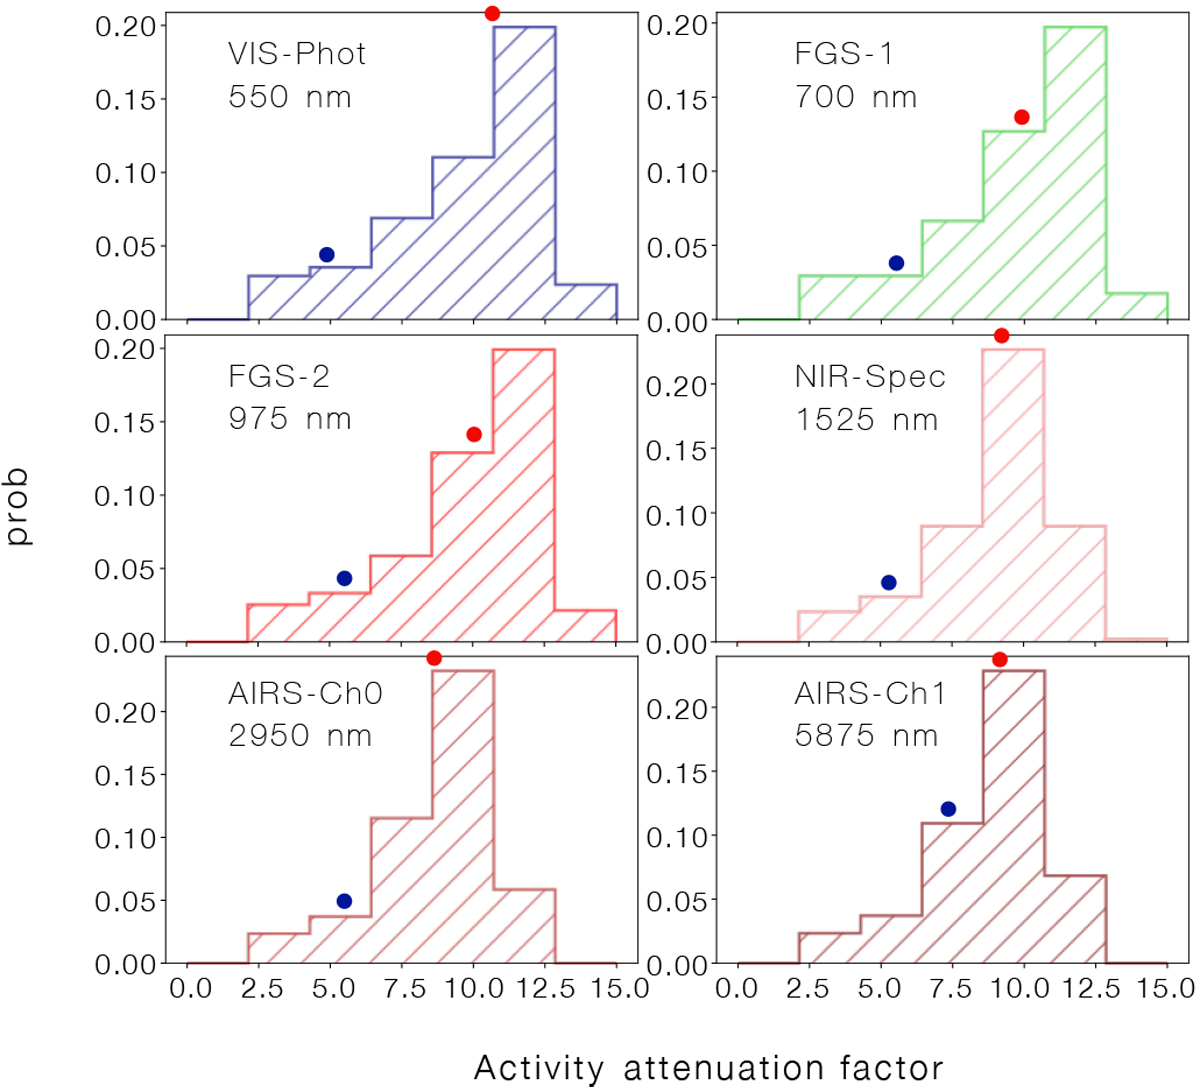
Distribution of activity attenuation factors from StarSim modelling considering all transit simulations. This factor is calculated as the ratio between the mean effect of spots on the transit depth and the uncertainty of the correction given by StarSim model (⟨SP(λ)⟩/σSP). Blue and red dots indicate the position in the histograms of the example transits TR-1 and TR-2, respectively.
Current usage metrics show cumulative count of Article Views (full-text article views including HTML views, PDF and ePub downloads, according to the available data) and Abstracts Views on Vision4Press platform.
Data correspond to usage on the plateform after 2015. The current usage metrics is available 48-96 hours after online publication and is updated daily on week days.
Initial download of the metrics may take a while.