Fig. 10
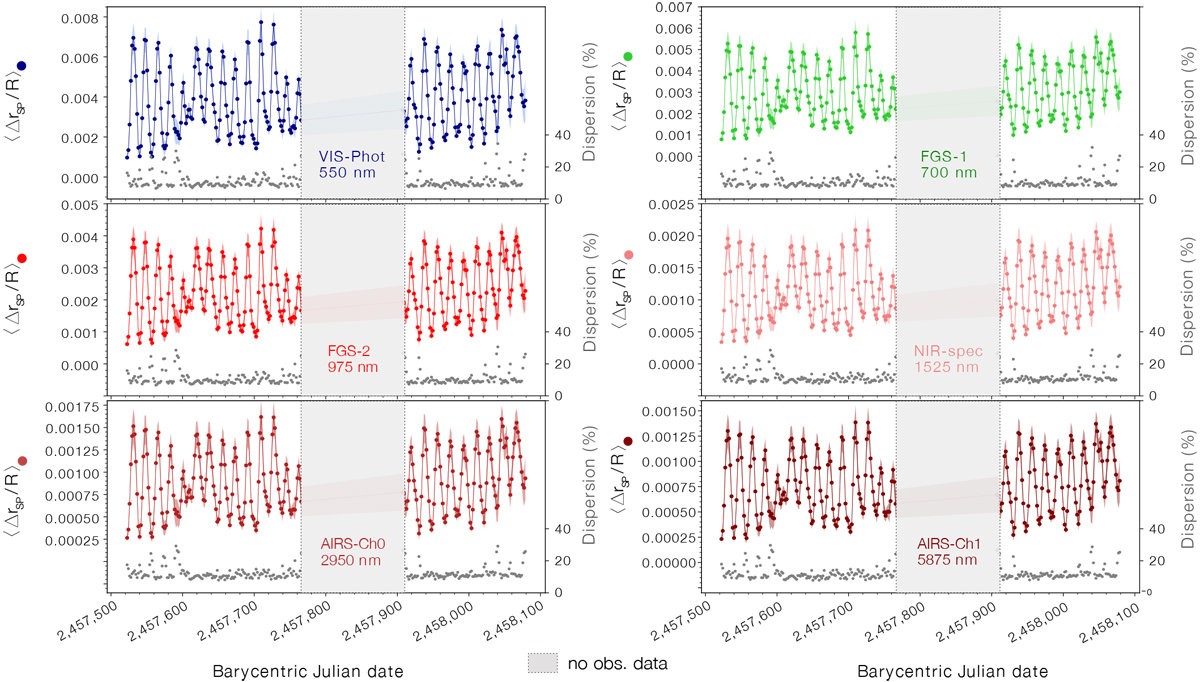
Effect of unocculted dark spots on the planetary radius ΔrSP∕R* over time fordifferent wavelength bands of the Ariel mission. The solid lines correspond to the average value of 21 optimal fits, and the 1σ confidence level is shown as a light-shaded band. Solid dots indicate the timestamps of WASP-52 b transits according to the available ephemeris. Note the different vertical scale for each wavelength panel. Gray dots at the bottom of the panels represent the variance (σ, as a percentage value) of the results calculated from the different maps, as labelled in the right axis. The gap in the middle of each plot corresponds to the period between observational seasons without available photometric data (see Fig. 8).
Current usage metrics show cumulative count of Article Views (full-text article views including HTML views, PDF and ePub downloads, according to the available data) and Abstracts Views on Vision4Press platform.
Data correspond to usage on the plateform after 2015. The current usage metrics is available 48-96 hours after online publication and is updated daily on week days.
Initial download of the metrics may take a while.