Open Access
Fig. 8
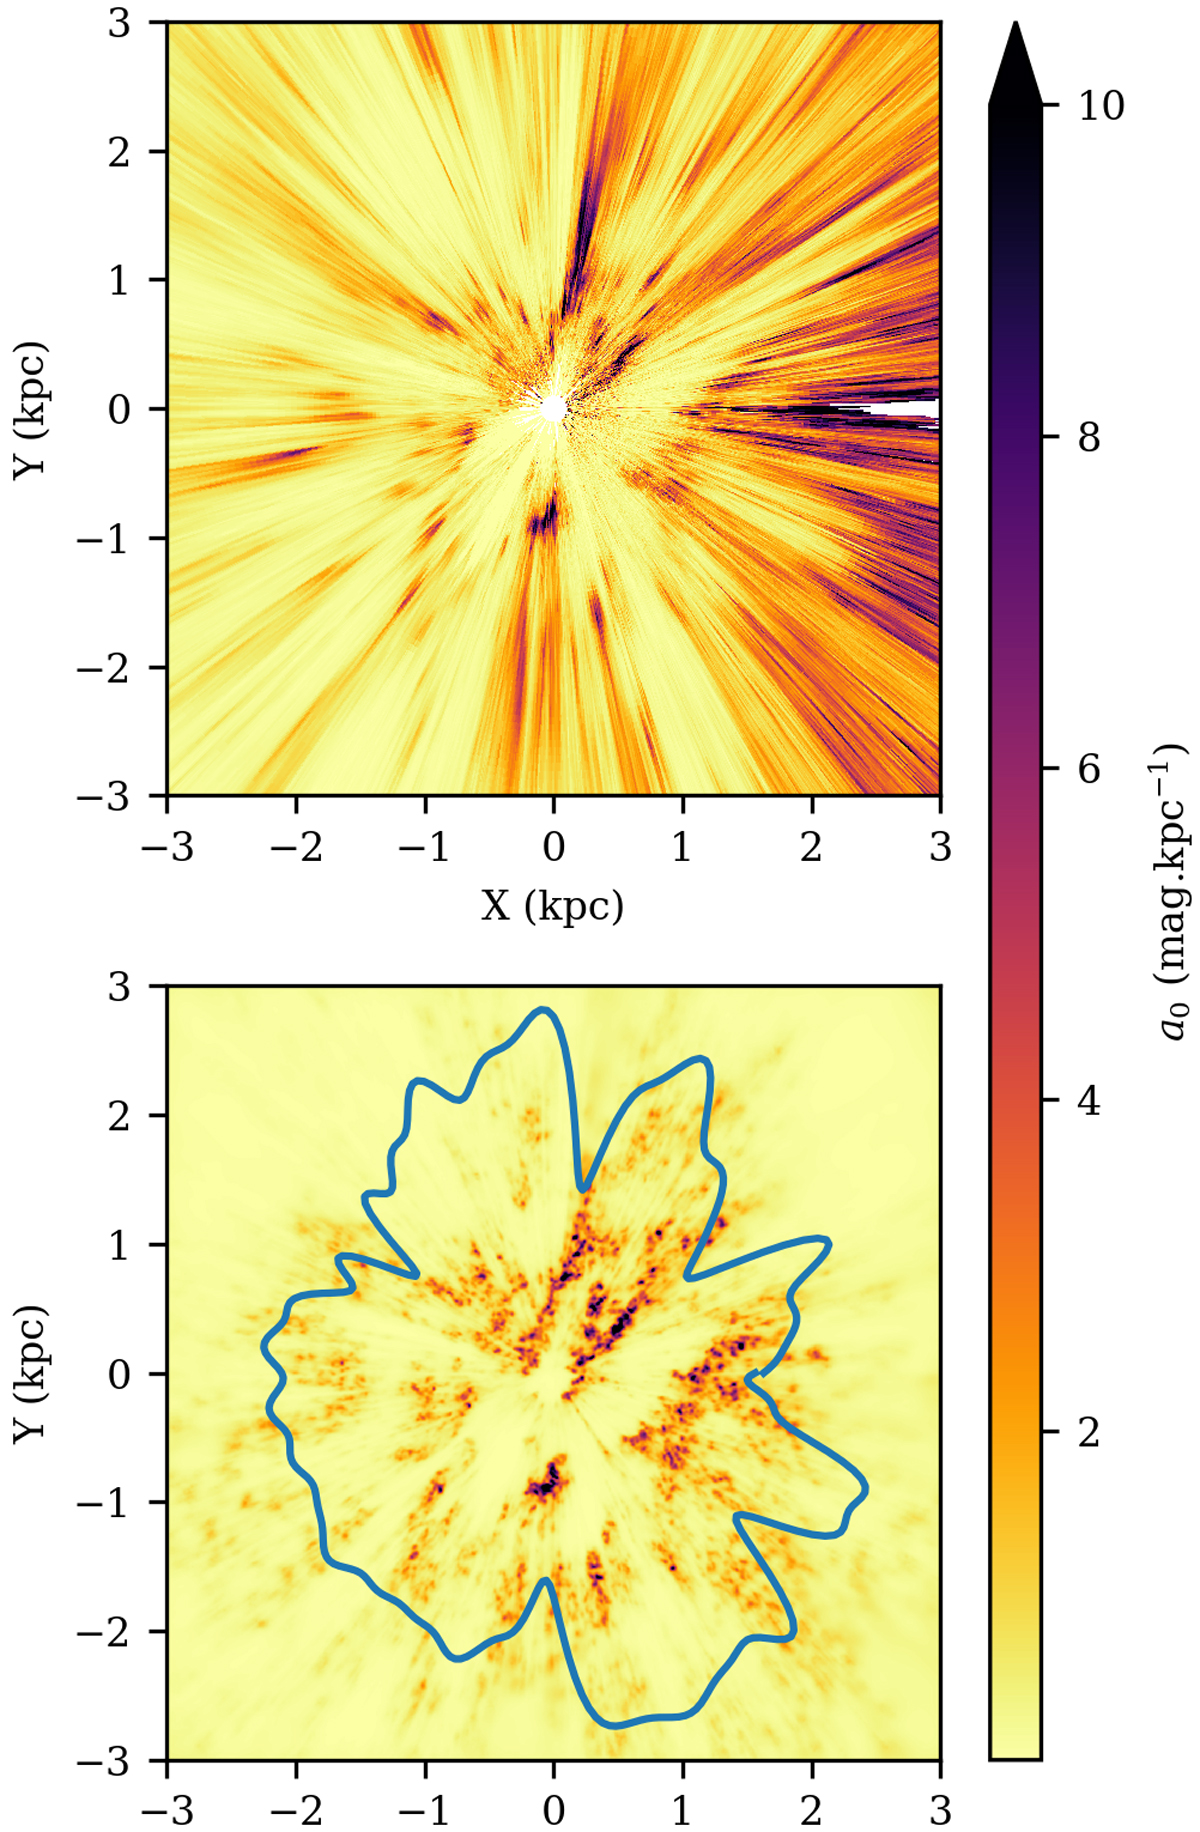
Comparison with Lallement et al. (2019) results. Both maps are plotted with the same distance ranges and the same colour map. The blue curve represents the confidence limit of the Lallement et al. (2019) results.
Current usage metrics show cumulative count of Article Views (full-text article views including HTML views, PDF and ePub downloads, according to the available data) and Abstracts Views on Vision4Press platform.
Data correspond to usage on the plateform after 2015. The current usage metrics is available 48-96 hours after online publication and is updated daily on week days.
Initial download of the metrics may take a while.