Free Access
Fig. 7.
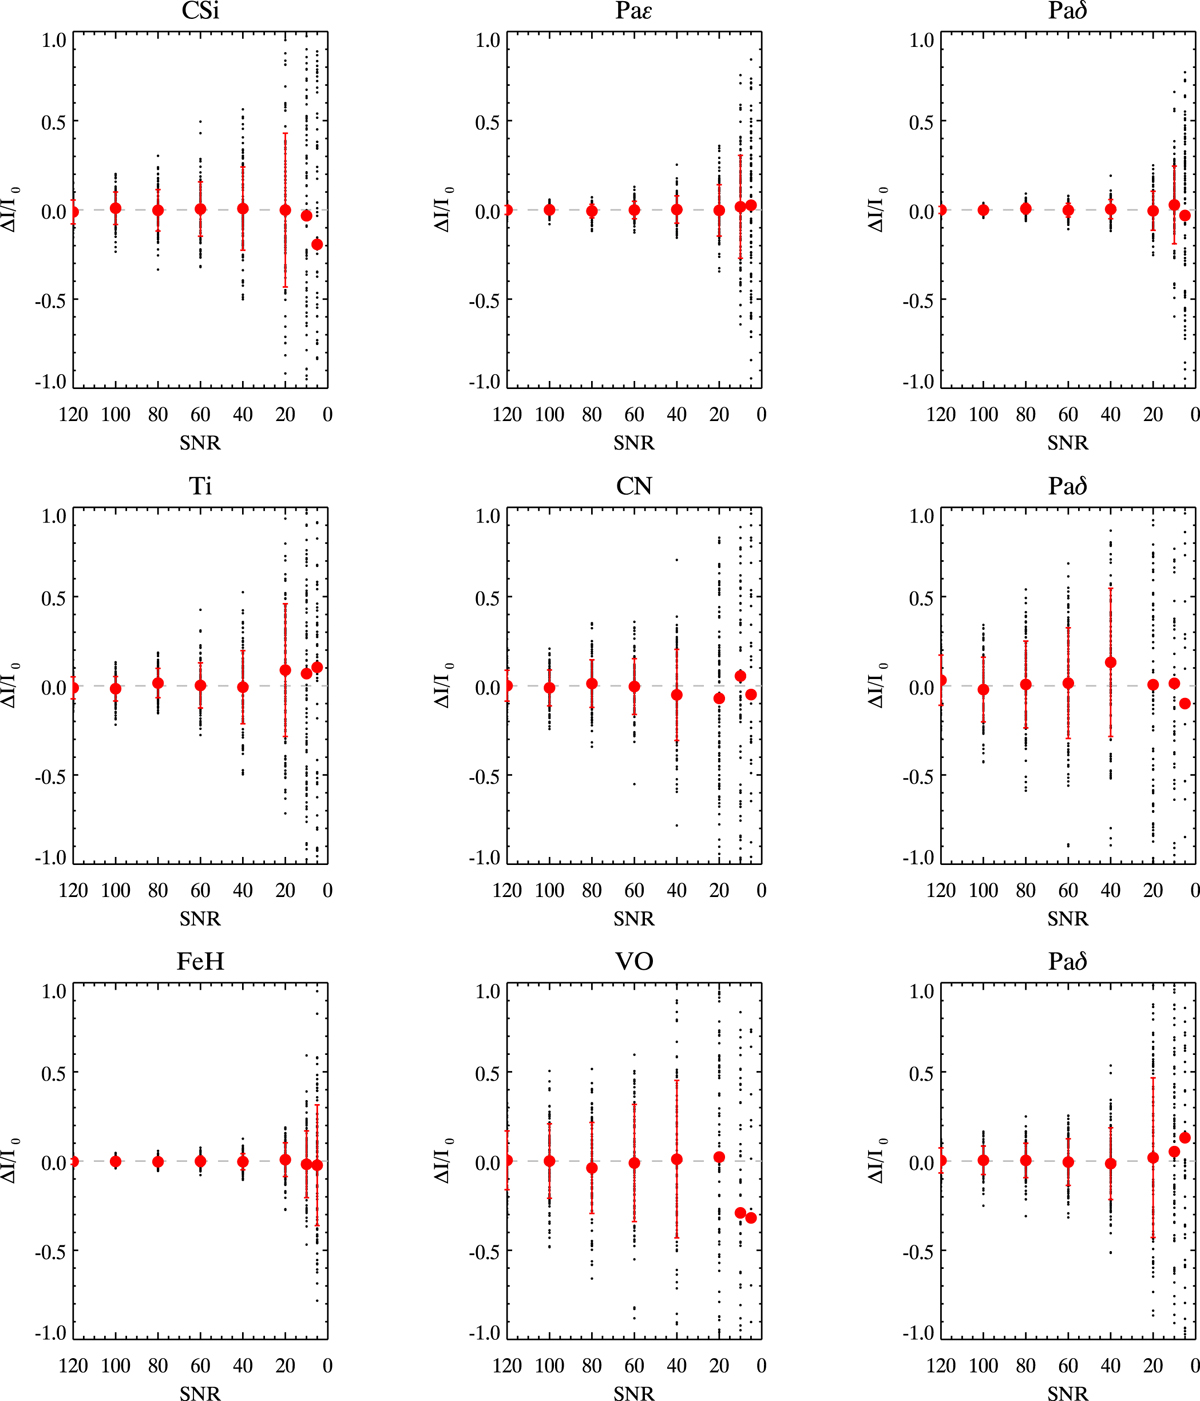
Deviation of the index (measured on the noisy artificial spectrum) from the index value in the “noiseless” spectrum, normalized by the latter, plotted versus the S/N of the noisy spectrum for Y band spectral features in MI (lower panels), KIII (central panels), and FII (upper panels) stars. The S/N is given per Å.
Current usage metrics show cumulative count of Article Views (full-text article views including HTML views, PDF and ePub downloads, according to the available data) and Abstracts Views on Vision4Press platform.
Data correspond to usage on the plateform after 2015. The current usage metrics is available 48-96 hours after online publication and is updated daily on week days.
Initial download of the metrics may take a while.