Fig. 1.
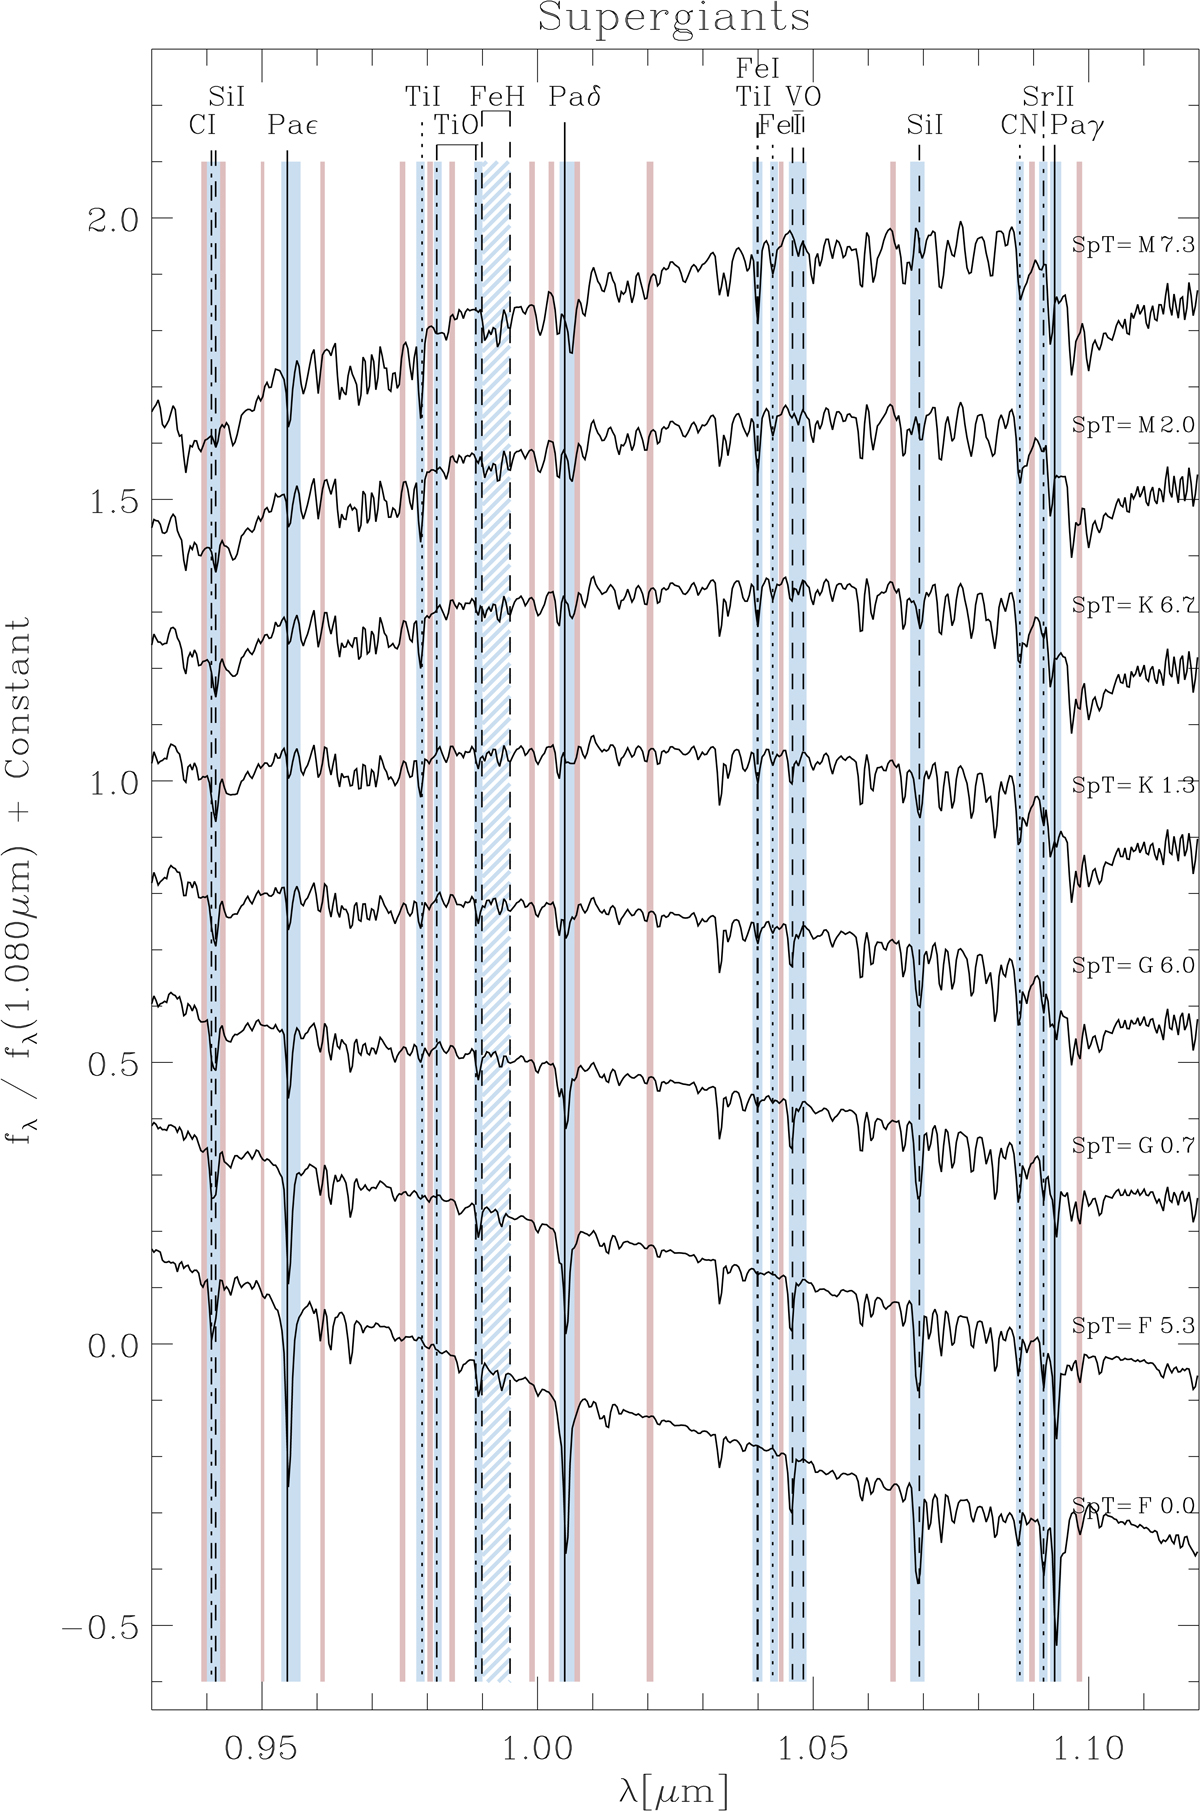
Y atmospheric window model spectra of supergiants obtained by fitting at each wavelength the flux-normalized (at 1.08 μm) sample spectra along SpTs. The model spectra for different SpTs are offset for displaying purposes and the SpTs are given on the right. The green regions mark the bandpasses of the newly defined indices, the gray regions mark their adjacent continuum as defined in this paper (see Table 1). Some relevant absorption features are marked. Here and for the other bands we did not consider features at the edges of the windows, because they can be affected by variable atmospheric transmission. The plots for stars of other luminosity classes and atmospheric windows are shown in Appendix A.
Current usage metrics show cumulative count of Article Views (full-text article views including HTML views, PDF and ePub downloads, according to the available data) and Abstracts Views on Vision4Press platform.
Data correspond to usage on the plateform after 2015. The current usage metrics is available 48-96 hours after online publication and is updated daily on week days.
Initial download of the metrics may take a while.