Open Access
Fig. 9.
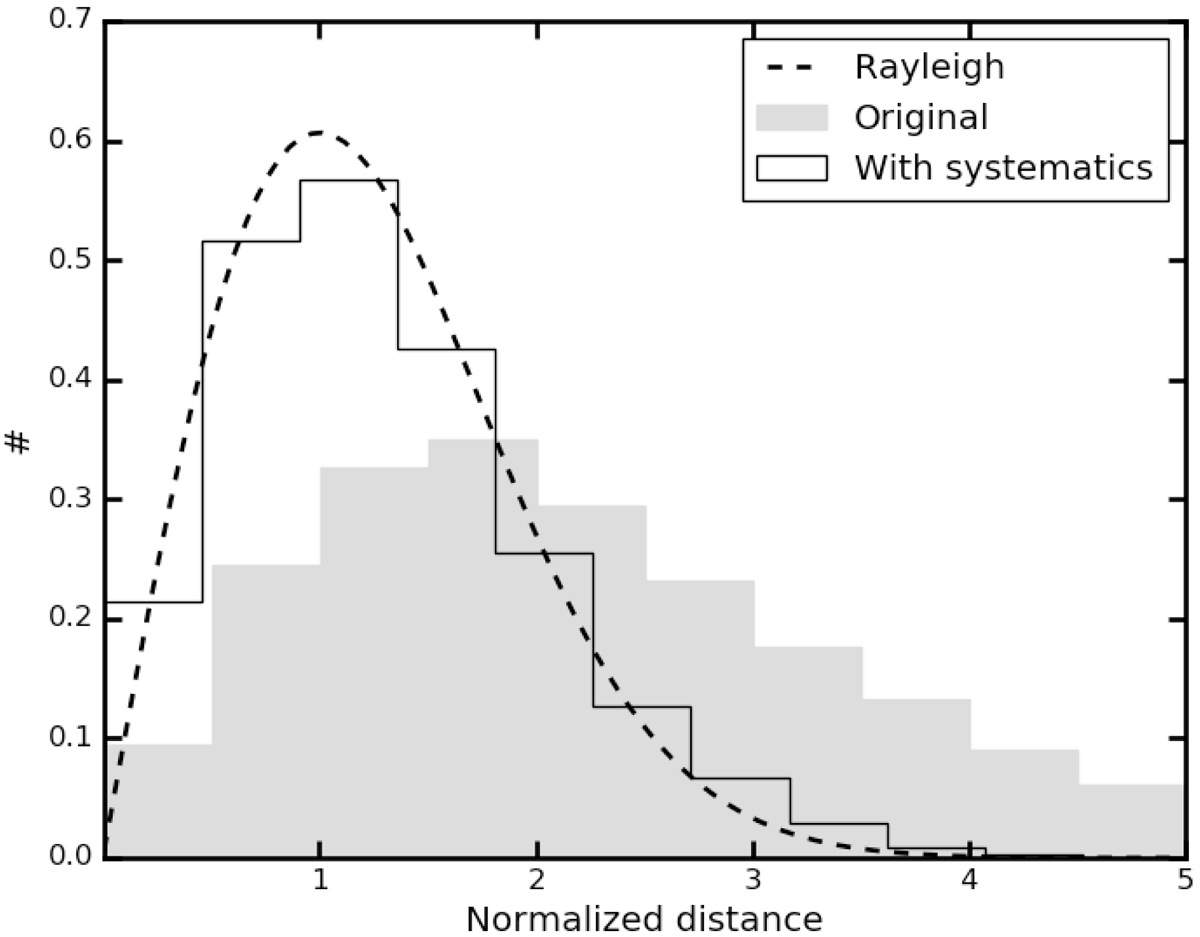
Fraction of XMM-Newton-SDSS quasar pairs as a function of normalised distance x, before adding a systematic uncertainty (grey histogram) and after its addition (black solid line), along with the Rayleigh distribution (black dashed line).
Current usage metrics show cumulative count of Article Views (full-text article views including HTML views, PDF and ePub downloads, according to the available data) and Abstracts Views on Vision4Press platform.
Data correspond to usage on the plateform after 2015. The current usage metrics is available 48-96 hours after online publication and is updated daily on week days.
Initial download of the metrics may take a while.