Fig. 5.
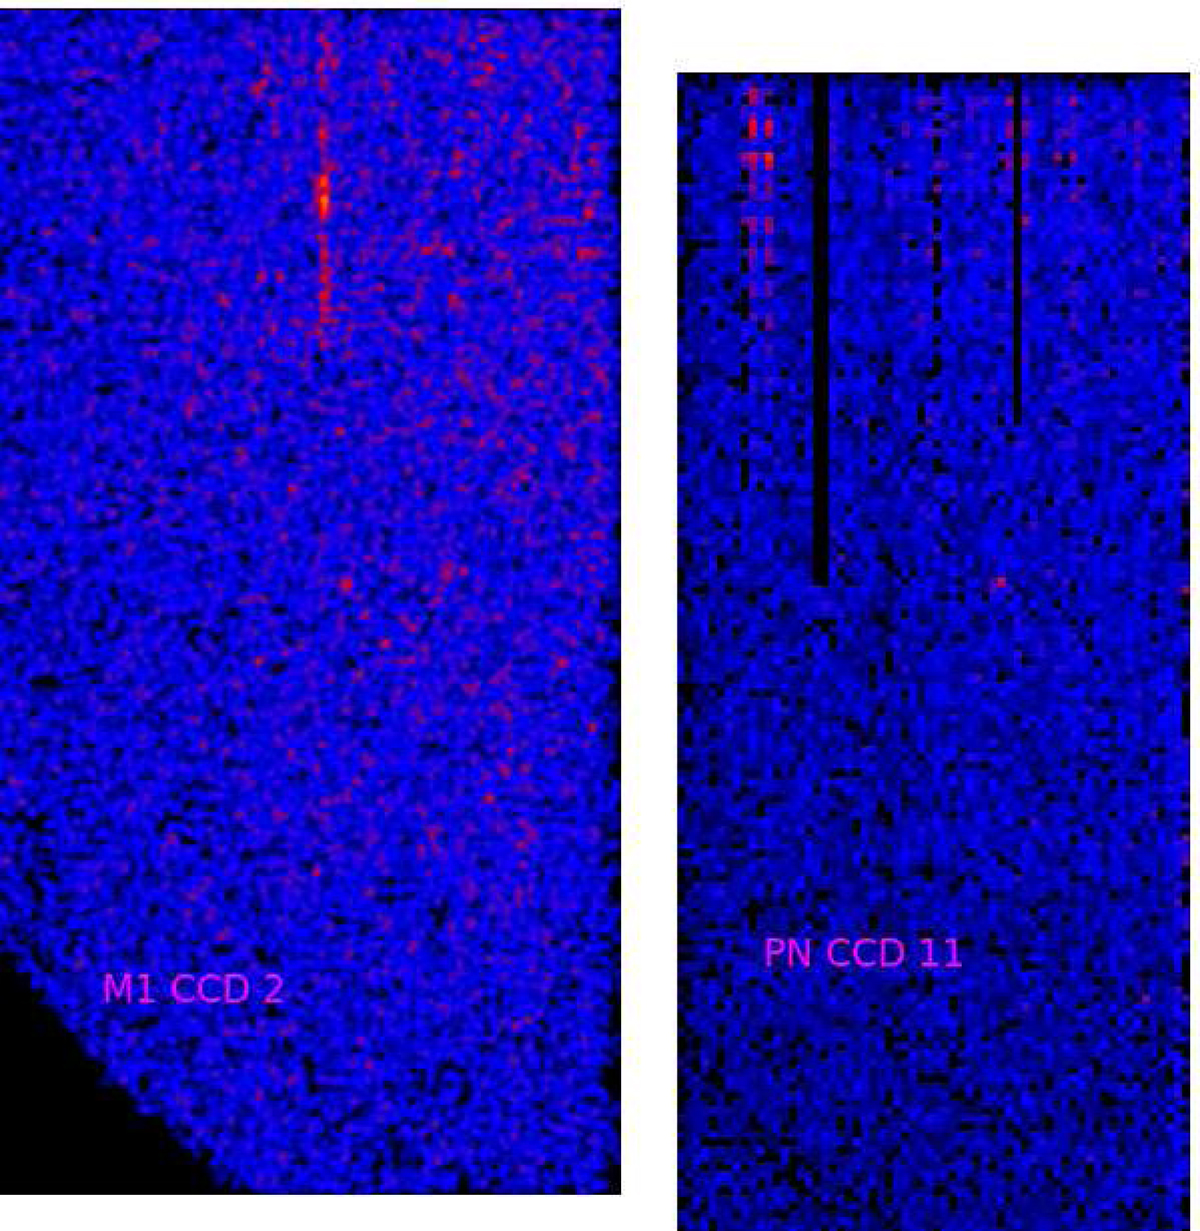
Same region and colour scale as in Fig. 4. Detections on a hot area and inside the associated revolution interval are rejected. The numbers inside hot areas in which the revolution interval is not the full interval are corrected for the different time coverage. The remaining features cannot be distinguished from statistical fluctuations with the current algorithm.
Current usage metrics show cumulative count of Article Views (full-text article views including HTML views, PDF and ePub downloads, according to the available data) and Abstracts Views on Vision4Press platform.
Data correspond to usage on the plateform after 2015. The current usage metrics is available 48-96 hours after online publication and is updated daily on week days.
Initial download of the metrics may take a while.