Fig. 4.
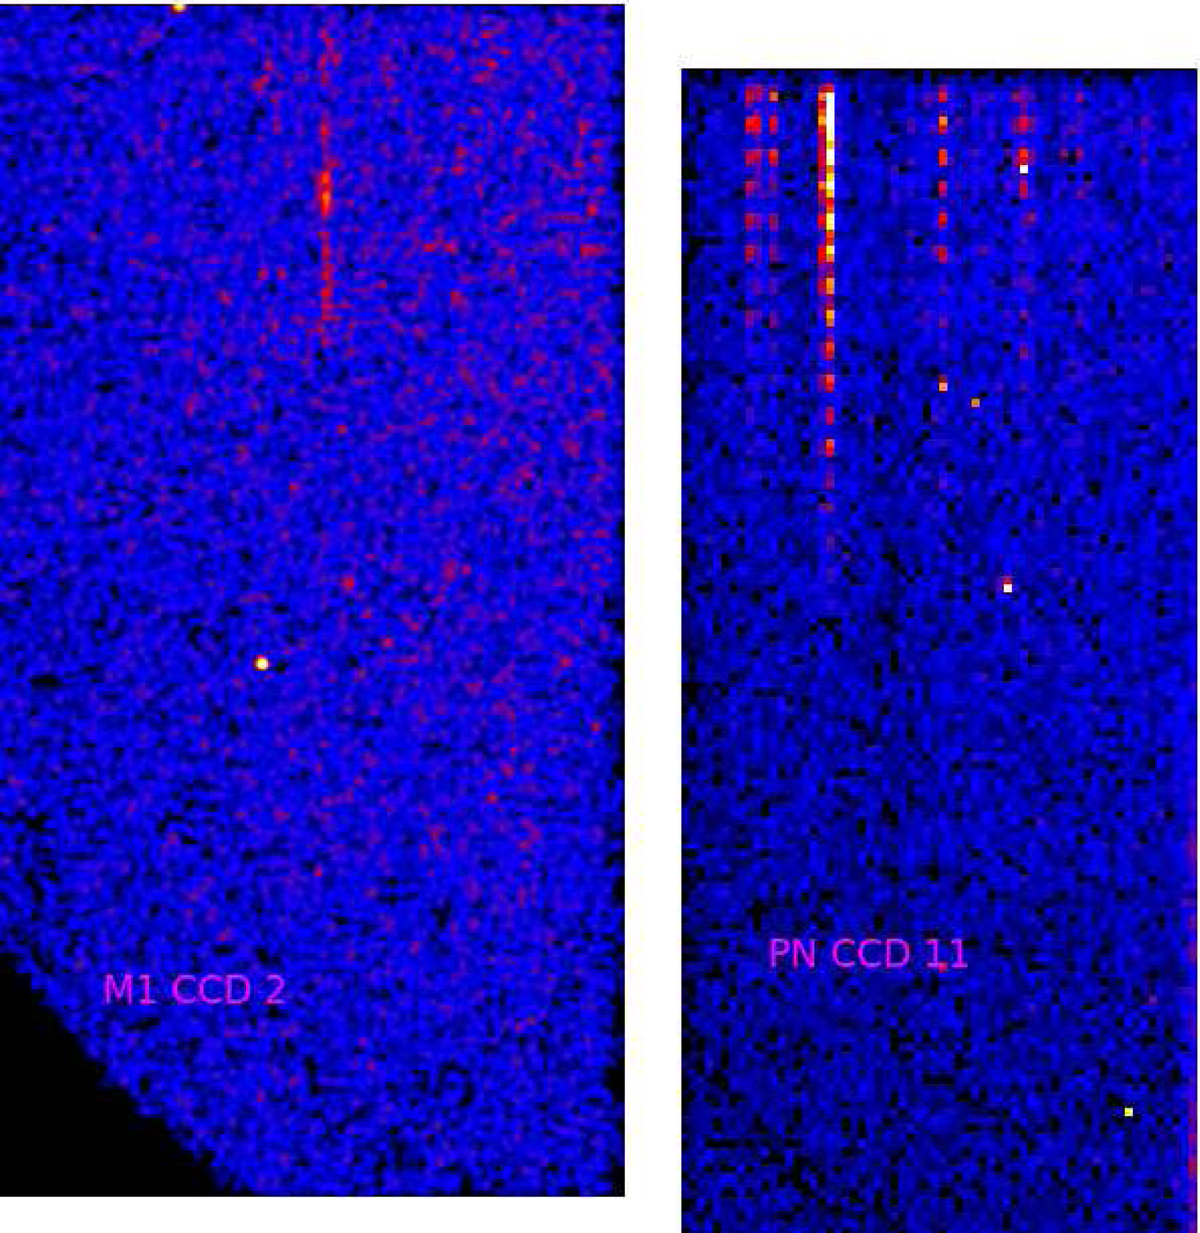
Same part of the focal plane (lower left in pn detector coordinates) viewed by pn (CCD 11) and MOS1 (CCD 2). The maps are in CCD coordinates, but offset and zoomed so that they are approximately aligned (a given detection appears at the same place on both maps). All point-like 4XMM detections with log(likelihood) XX_8_DET_ML > 6.5 in the total band for the current instrument (XX) are accumulated on each map. The MOS1 map is smoothed with a 3 × 3 boxcar average. The colour scale is square root between zero and three detections per pixel in MOS1, 0 and 100 in pn. Obvious hot areas are visible. They appear in only one instrument because the detections on hot areas have DET_ML > 6.5 only in the instrument where the hot area is, contrary to real detections. MOS2 is omitted because it shows no hot area in that part of the focal plane.
Current usage metrics show cumulative count of Article Views (full-text article views including HTML views, PDF and ePub downloads, according to the available data) and Abstracts Views on Vision4Press platform.
Data correspond to usage on the plateform after 2015. The current usage metrics is available 48-96 hours after online publication and is updated daily on week days.
Initial download of the metrics may take a while.