Fig. 10.
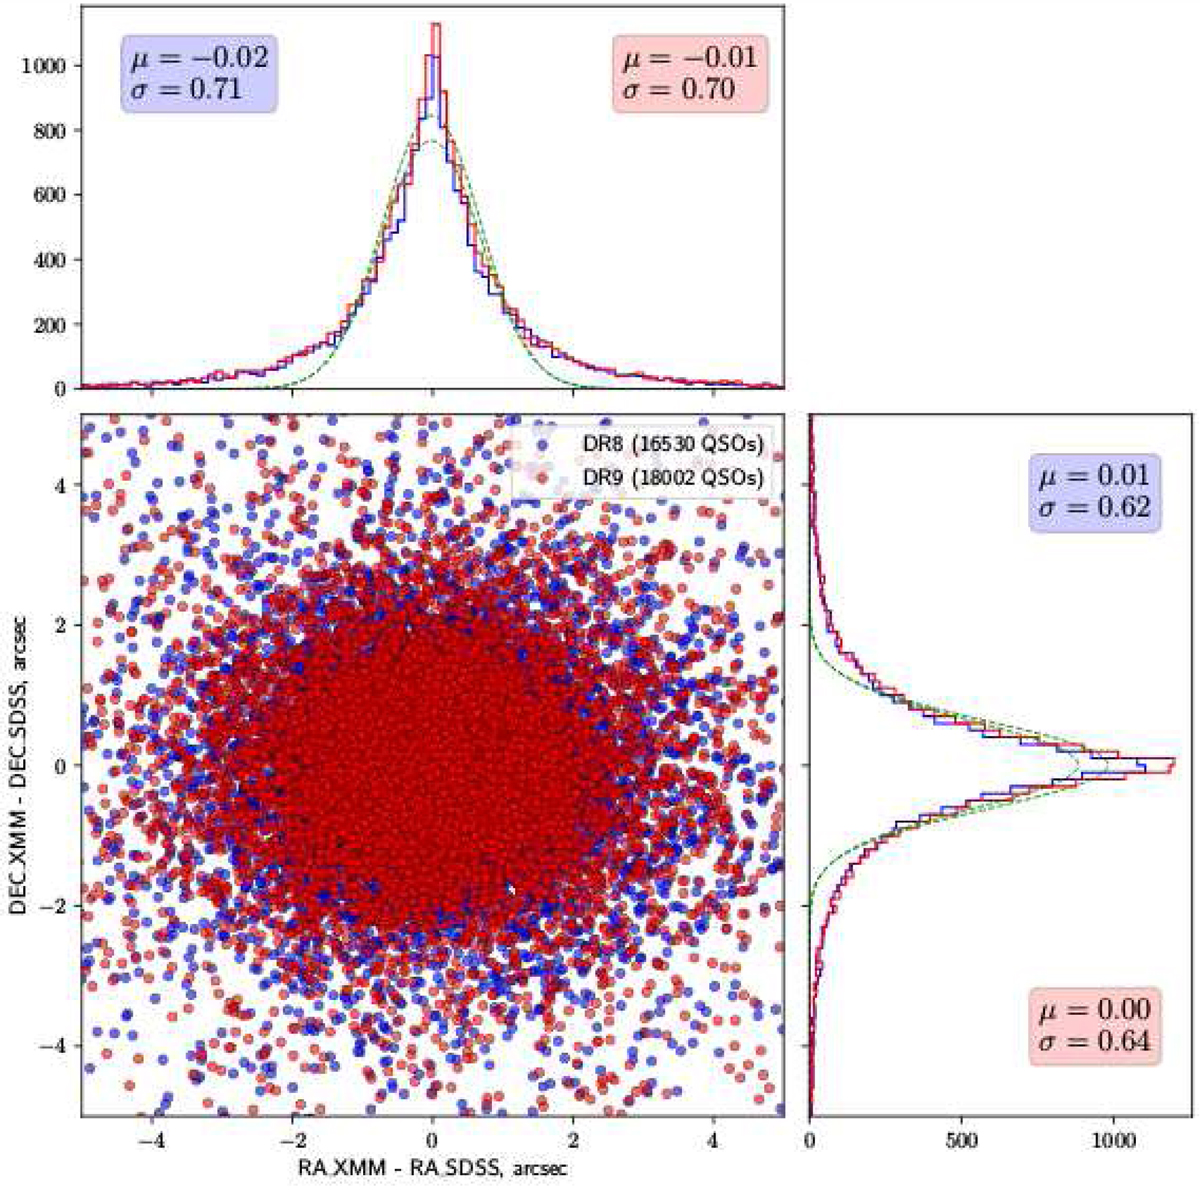
Scatter plot and associated distribution of the RA and Dec offsets between the XMM sources and the SDSS optical quasars. Two versions of the XMM catalogues are compared: 4XMM-DR9 (red) and 3XMM-DR8 (blue). The dashed green curves in the histogram plots represent gaussian fits to the distributions. The derived mean μ and standard deviation σ for each fit are shown in the coloured boxes respectively.
Current usage metrics show cumulative count of Article Views (full-text article views including HTML views, PDF and ePub downloads, according to the available data) and Abstracts Views on Vision4Press platform.
Data correspond to usage on the plateform after 2015. The current usage metrics is available 48-96 hours after online publication and is updated daily on week days.
Initial download of the metrics may take a while.