Fig. 9
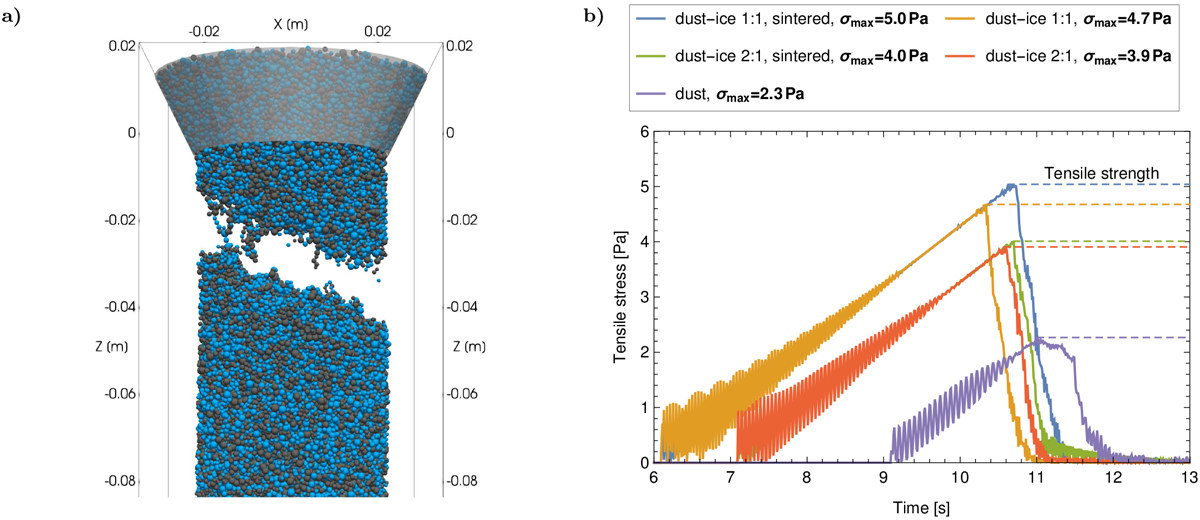
Simulated tensile strength test. (a) A 10 cm-high and 5 cm-wide cylinder made up of a mixture of dust (gray spheres) and ice (blue spheres) particles is mounted in a clamp (a numerical wall with the shape of a truncated cone) with its flat top side, while a gradually increasing force is pulling on the cylinder’s flat bottom side until the cylinder breaks apart (shown here). (b) Time evolution of tensile stress for selected materials made up of particles with diameters of 1–2 mm. The horizontal dashed line pointing to the maximum of a curve is the stress at the breaking point, i.e., the material’s tensile strength σmax (values given in plot legend for each material). The oscillations in the early phase of the stress build-up result from longitudinal waves in the cylinder excited by the stepwise increase of the force pulling at the bottom. Their amplitudes decrease as the tension in the cylinder increases. Stresses measured during the preparation of the material samples are omitted for better representation.
Current usage metrics show cumulative count of Article Views (full-text article views including HTML views, PDF and ePub downloads, according to the available data) and Abstracts Views on Vision4Press platform.
Data correspond to usage on the plateform after 2015. The current usage metrics is available 48-96 hours after online publication and is updated daily on week days.
Initial download of the metrics may take a while.