Fig. 3.
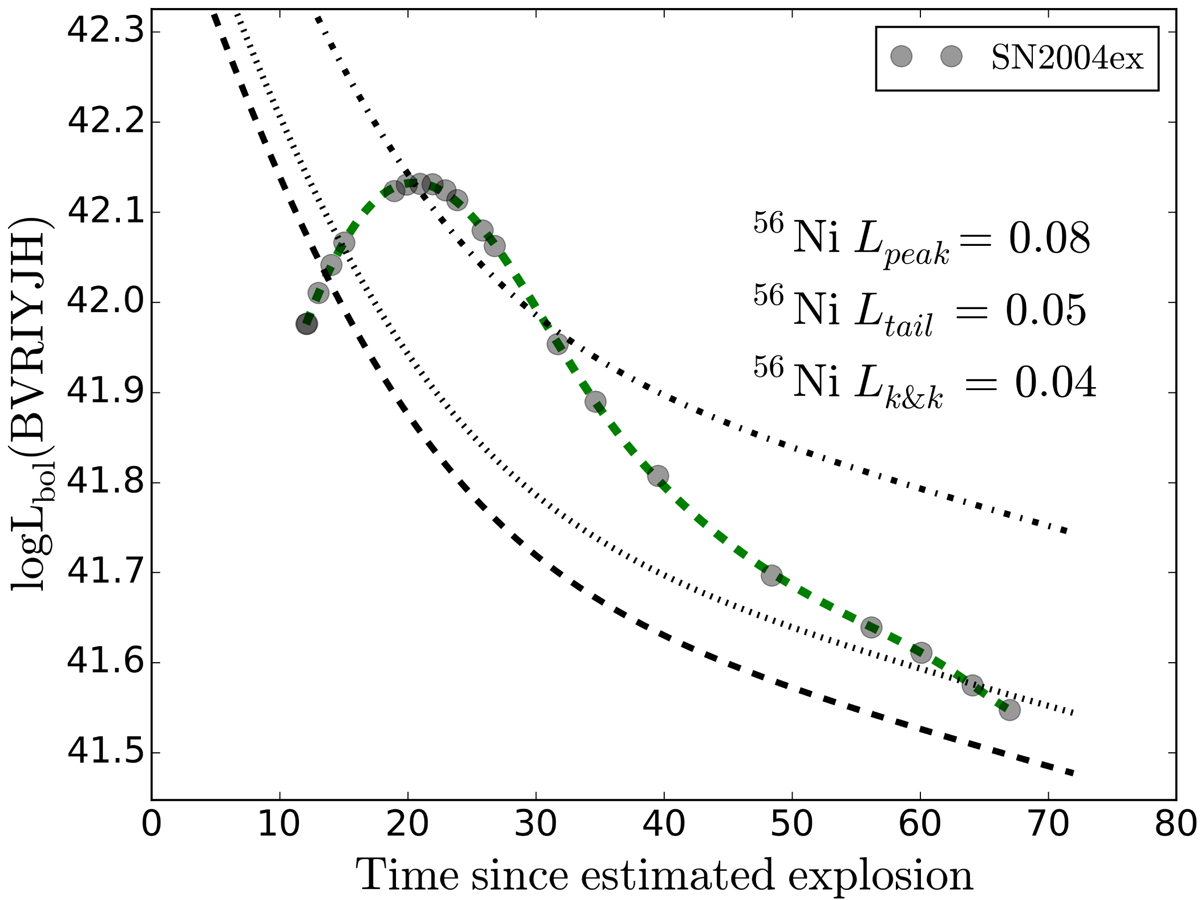
Example light curve and analysis results for the well sampled BVRIYJH bolometric light curve of SN 2004ex. The dashed-dotted, dashed, and dotted lines marks the 56Ni decay, assuming an initial 56Ni mass given by Arnett’s rule, the Khatami & Kasen (2019) method (dubbed “k&k”), and the lower limit from the Tail respectively. The fit used to obtain the maximum of the light curve is shown as a green dashed line.
Current usage metrics show cumulative count of Article Views (full-text article views including HTML views, PDF and ePub downloads, according to the available data) and Abstracts Views on Vision4Press platform.
Data correspond to usage on the plateform after 2015. The current usage metrics is available 48-96 hours after online publication and is updated daily on week days.
Initial download of the metrics may take a while.