Fig. 2.
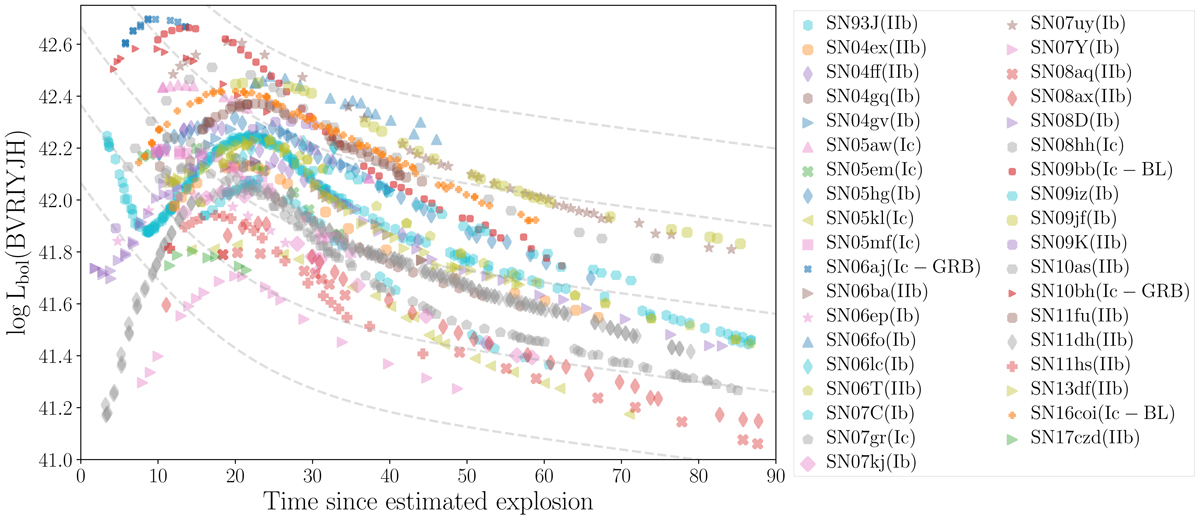
BVRIYJH bolometric light curves for our sample of 37 SE-SNe. SN types are listed in the legend. The dashed grey curves show reference 56Ni decays, with a factor of two in 56Ni mass separation. From these reference slopes its can be seen that all SE-SNe within our sample decline steeper than the 56Ni decay after ∼60 days past explosion.
Current usage metrics show cumulative count of Article Views (full-text article views including HTML views, PDF and ePub downloads, according to the available data) and Abstracts Views on Vision4Press platform.
Data correspond to usage on the plateform after 2015. The current usage metrics is available 48-96 hours after online publication and is updated daily on week days.
Initial download of the metrics may take a while.