Free Access
Fig. C.1.
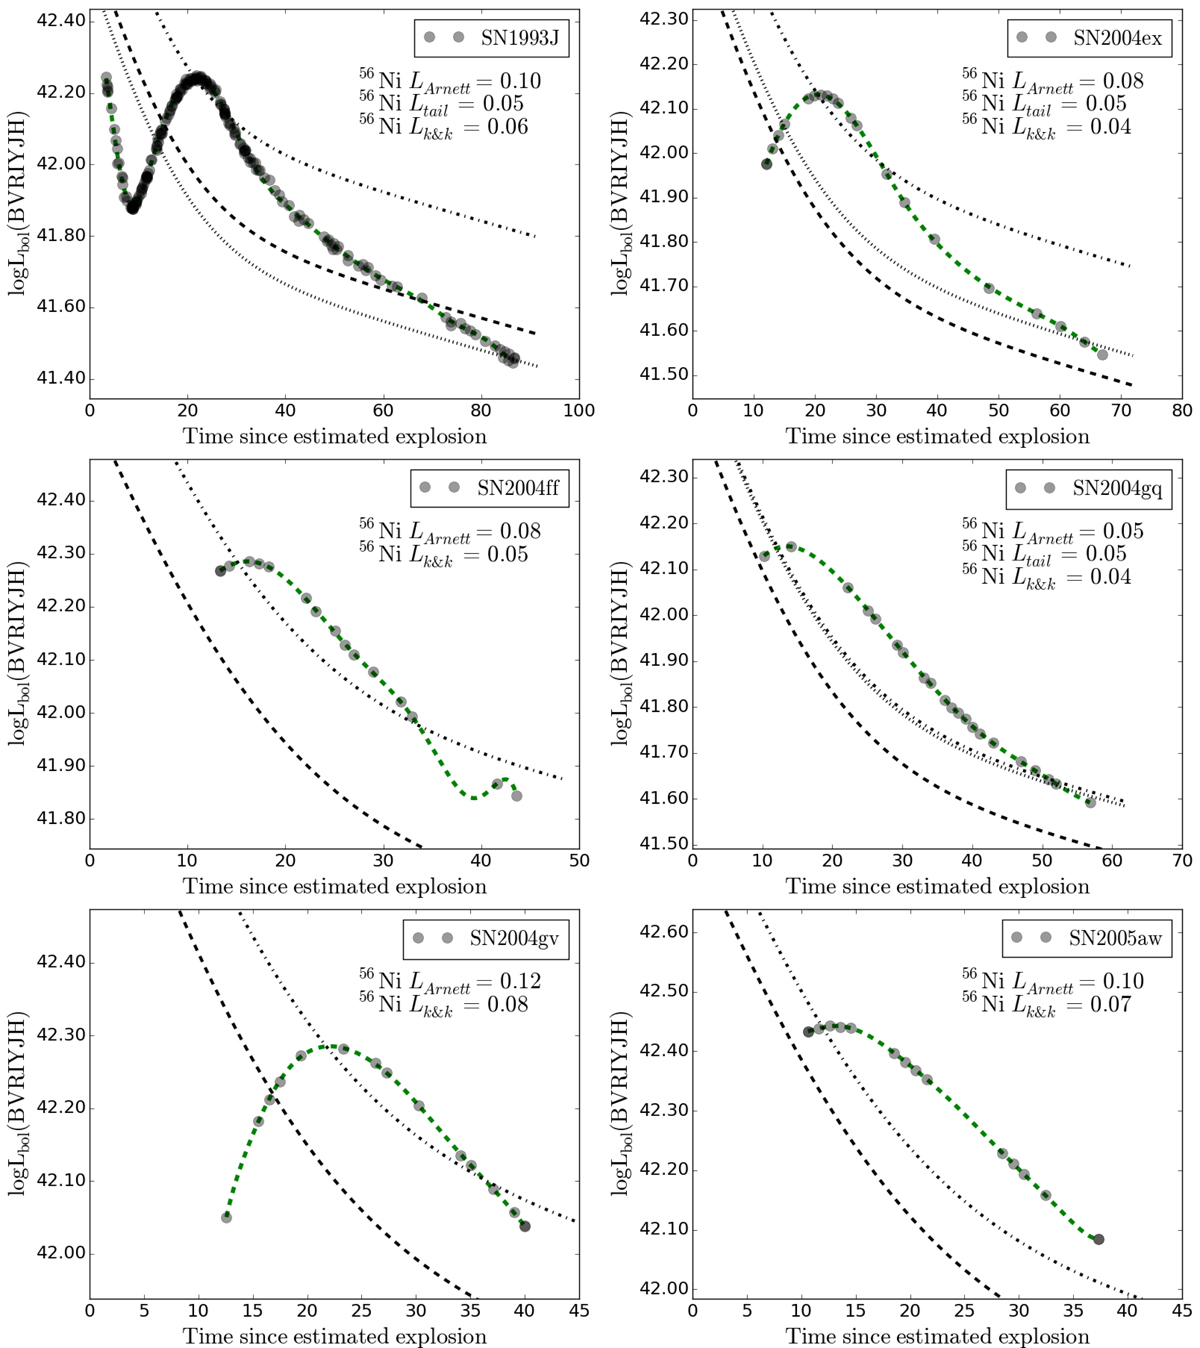
BVRIYJH pseudo-bolometric light curves for SE-SNe. The dotted lines give the 56Ni mass decay curve for that estimated through the Tail. The dashed line gives the 56Ni mass decay curve from Khatami & Kasen (2019), while the dot-dashed line gives that from Arnett.
Current usage metrics show cumulative count of Article Views (full-text article views including HTML views, PDF and ePub downloads, according to the available data) and Abstracts Views on Vision4Press platform.
Data correspond to usage on the plateform after 2015. The current usage metrics is available 48-96 hours after online publication and is updated daily on week days.
Initial download of the metrics may take a while.