Free Access
Fig. 1.
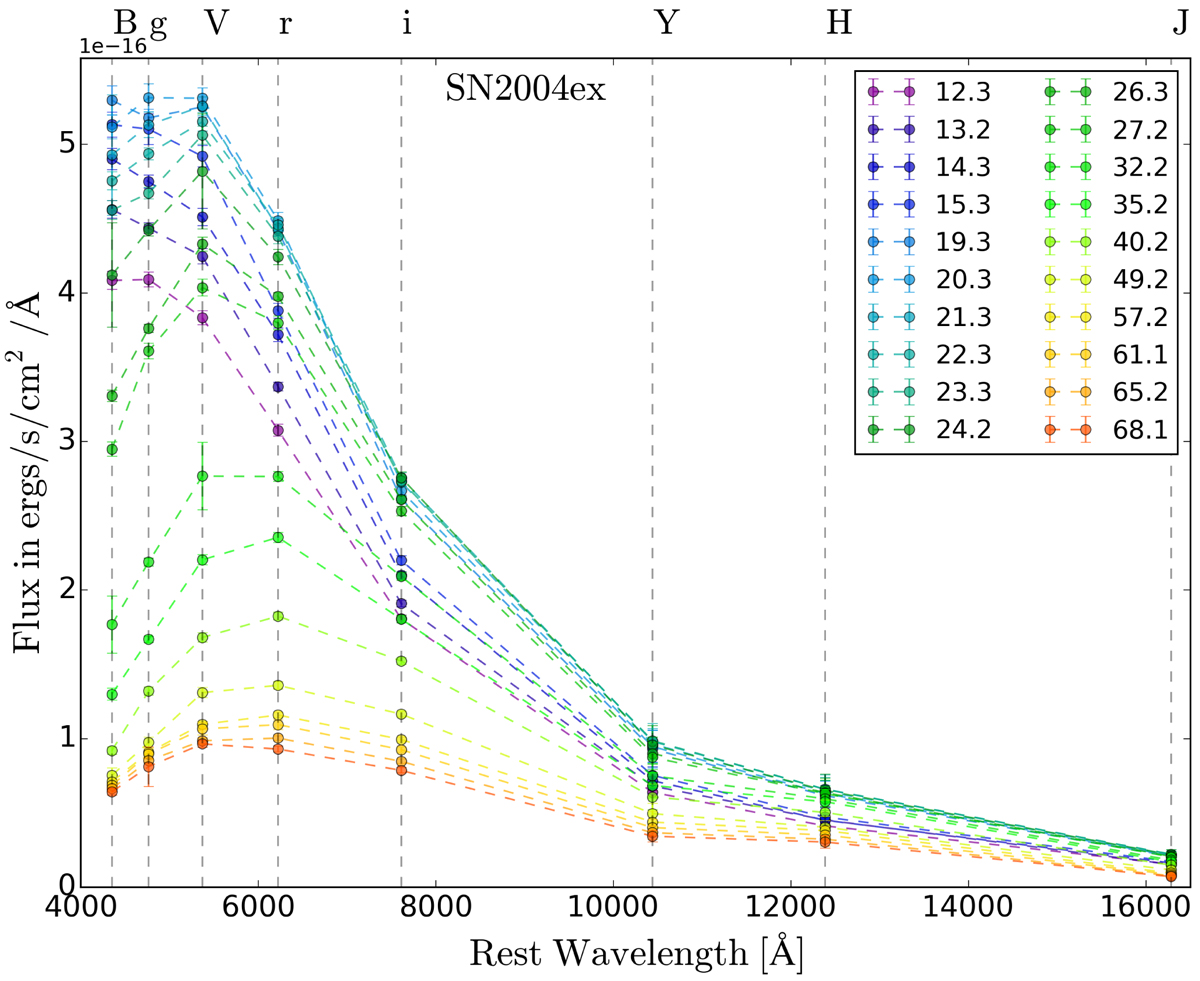
Example of the temporal SED evolution for the type IIb SN 2004ex. Each SED is colour coded by the time since explosion (listed in the legend, in days). Each filter is labelled with a dashed vertical line and the name of the filter is given on the top axis.
Current usage metrics show cumulative count of Article Views (full-text article views including HTML views, PDF and ePub downloads, according to the available data) and Abstracts Views on Vision4Press platform.
Data correspond to usage on the plateform after 2015. The current usage metrics is available 48-96 hours after online publication and is updated daily on week days.
Initial download of the metrics may take a while.