Fig. 3
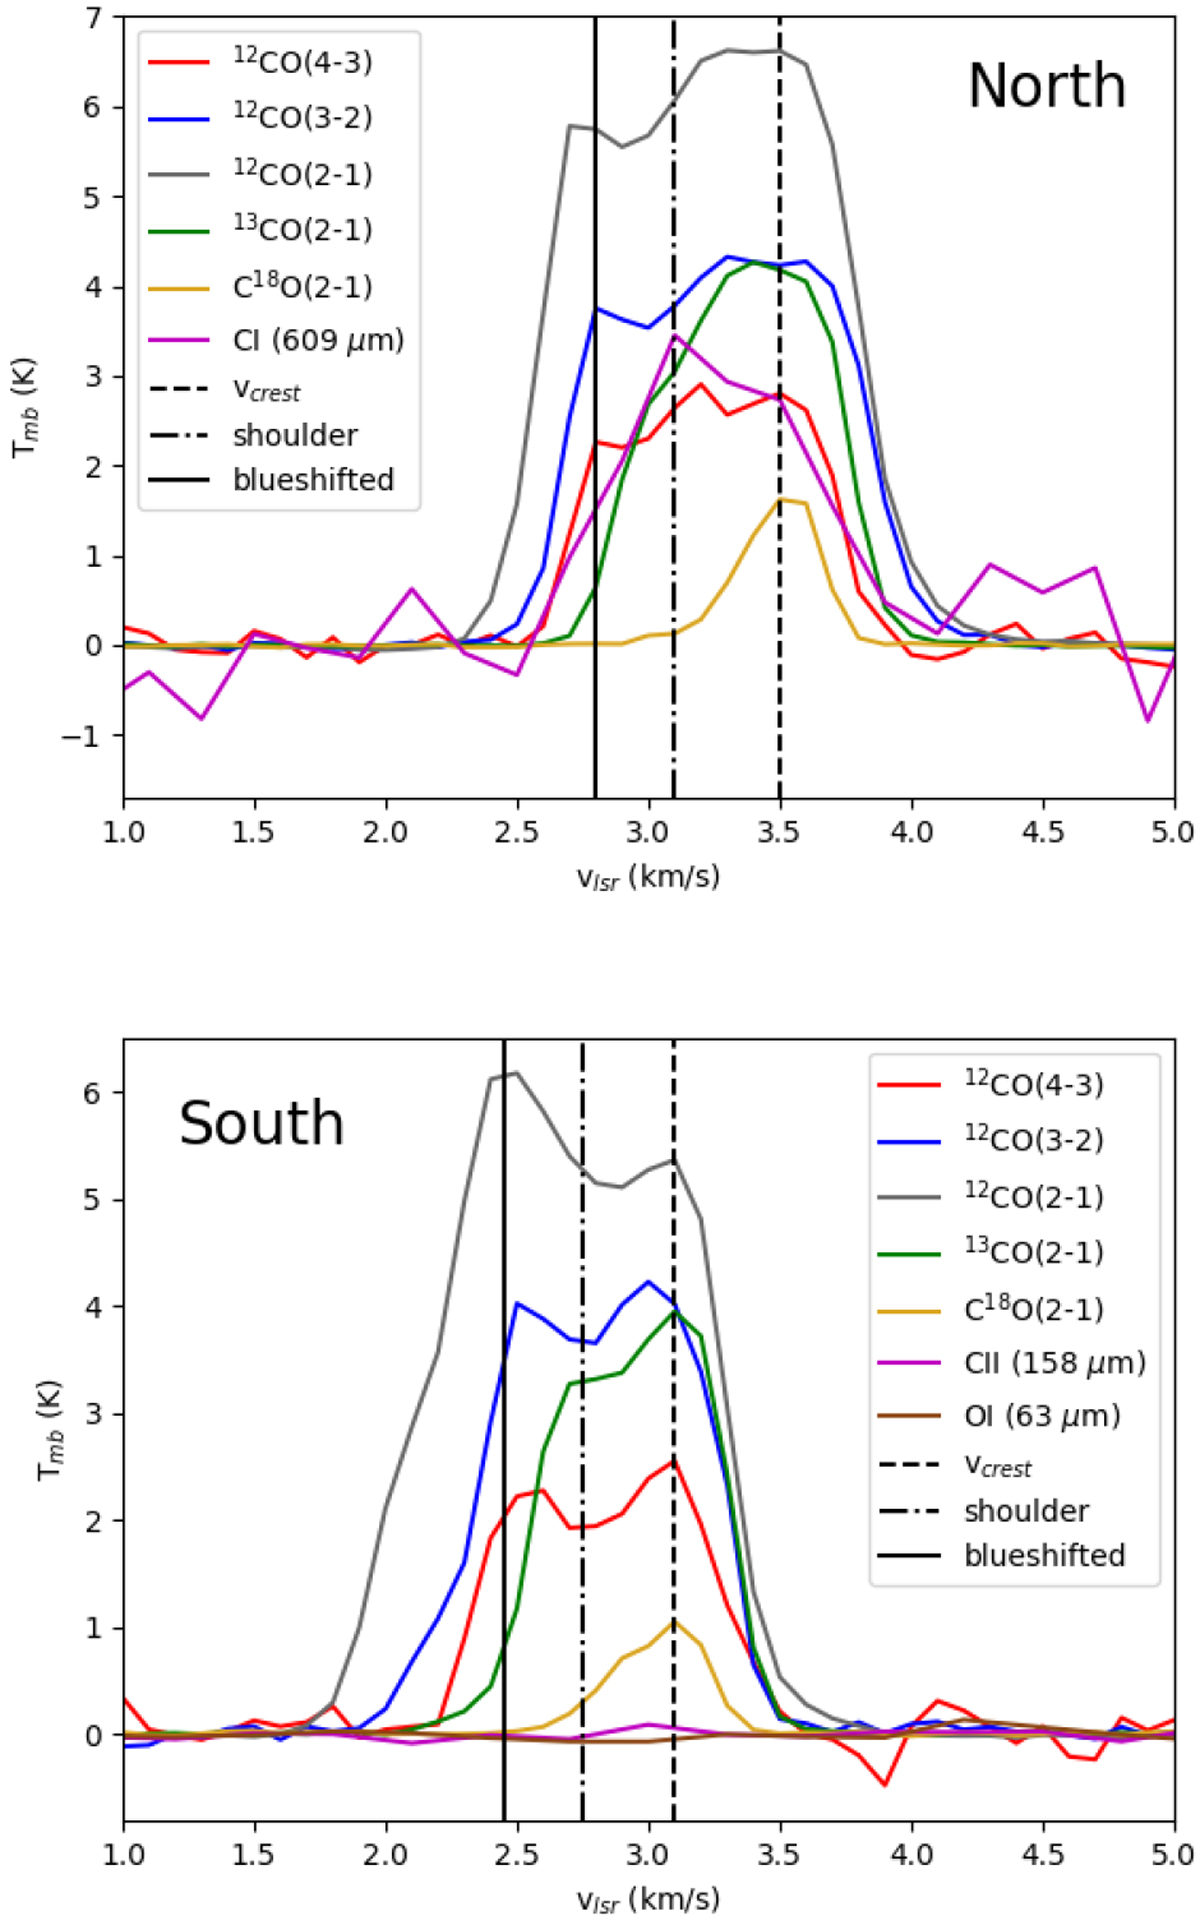
Top: APEX CO and [C I] spectra in the northern map, averaged over the filament crest (N > 3 × 1021cm−2). Bottom: APEX CO spectra averaged over the southern map and the 7-pixel averaged SOFIA [C II] and [O I] lines that are not detected above the 3σ level. We note the prominent blueshifted velocity component around 2.8 km s−1 in the north and at 2.5 km s−1 in the south, only visible in the 12CO lines.
Current usage metrics show cumulative count of Article Views (full-text article views including HTML views, PDF and ePub downloads, according to the available data) and Abstracts Views on Vision4Press platform.
Data correspond to usage on the plateform after 2015. The current usage metrics is available 48-96 hours after online publication and is updated daily on week days.
Initial download of the metrics may take a while.