Fig. A.2
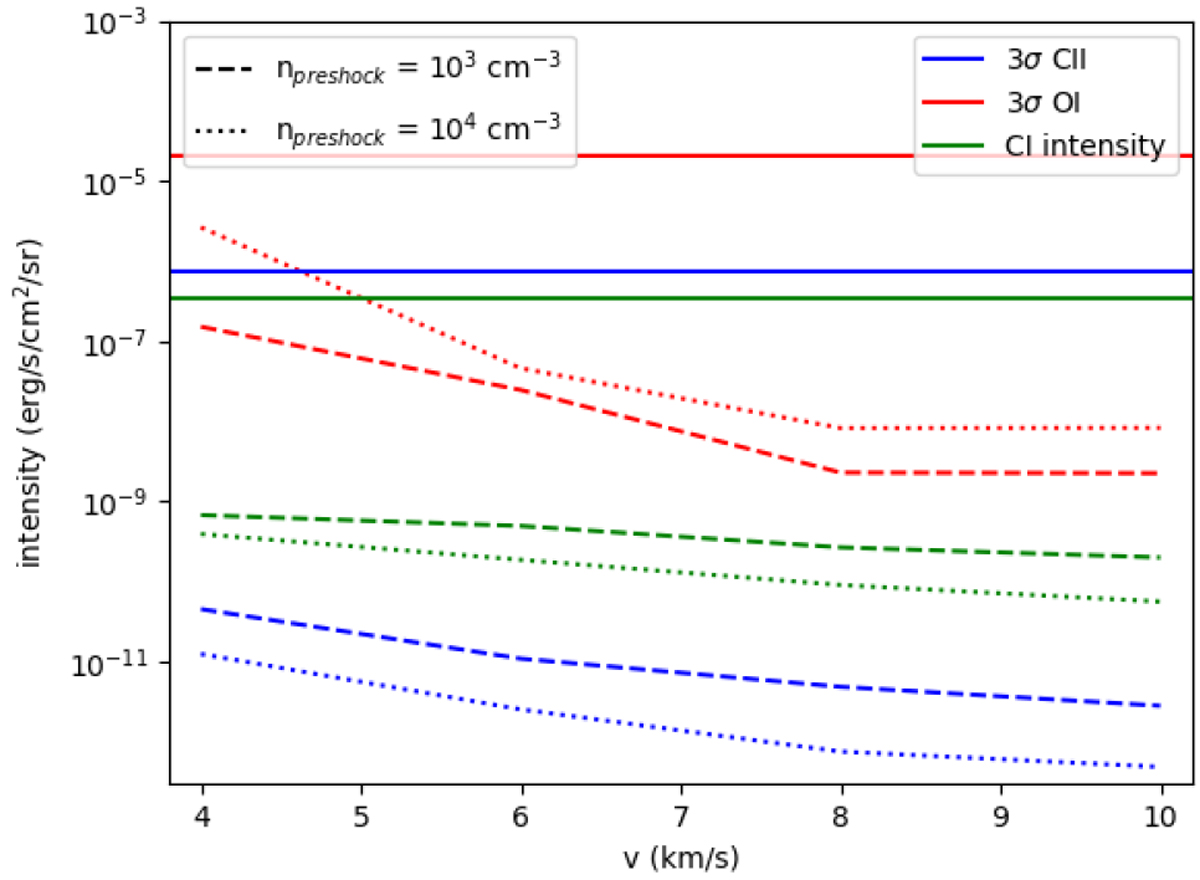
Intensity of [C II] (blue), [O I] (red), and [C I] (green) predicted for J-type shock models with a preshock density of n = 103 cm−3 and n = 104 cm−3 by the Paris-Durham code. The horizontal lines indicate the observed [C I] intensity and 3 σ upper limits for [C II] and [O I]. This shows that the [C II] and [O I] non-detections in Musca are consistent with shocks and that the [C I] brightness from the shock is not brighter than the total observed [C I] brightness in Musca.
Current usage metrics show cumulative count of Article Views (full-text article views including HTML views, PDF and ePub downloads, according to the available data) and Abstracts Views on Vision4Press platform.
Data correspond to usage on the plateform after 2015. The current usage metrics is available 48-96 hours after online publication and is updated daily on week days.
Initial download of the metrics may take a while.