Fig. 11
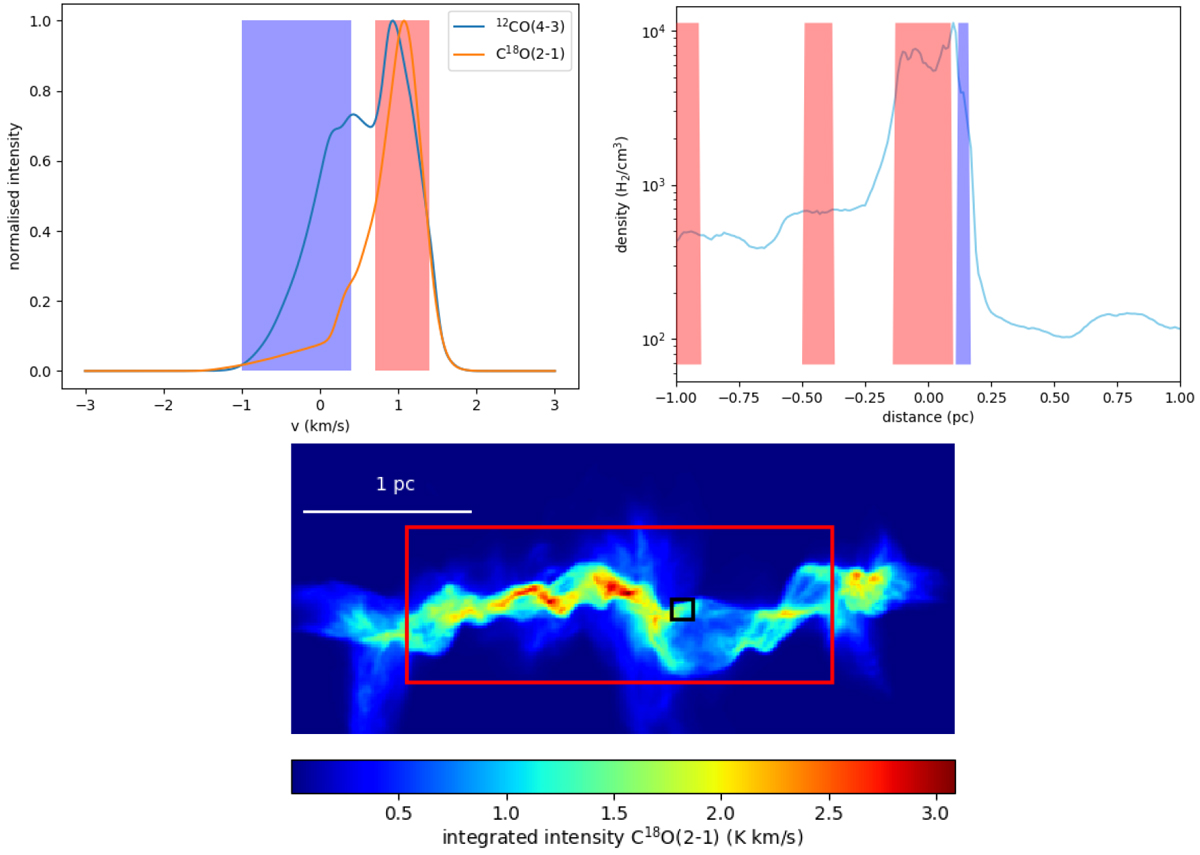
Bottom: C18O(2–1) integrated intensity map of the simulation (Clarke et al. 2018), with the black square indicating the region that is studied in this figure. The red box indicates the region displayed in Fig. 12. Left: 12CO(4–3) and C18O(2–1) spectra extracted from the square which show a blueshifted 12CO(4–3) component (blue) in addition to the component related to the bulk emission of the filament crest (red). The two velocity intervals used for the plot on the right are indicated in blue and red. Right: physical location along the line of sight of the gas in the velocity intervals, showing that the larger blueshifted velocity interval covers a small region compared to the filament and that it is located at the border of this filament where the density strongly increases because of a filament accretion shock.
Current usage metrics show cumulative count of Article Views (full-text article views including HTML views, PDF and ePub downloads, according to the available data) and Abstracts Views on Vision4Press platform.
Data correspond to usage on the plateform after 2015. The current usage metrics is available 48-96 hours after online publication and is updated daily on week days.
Initial download of the metrics may take a while.