Fig. 7
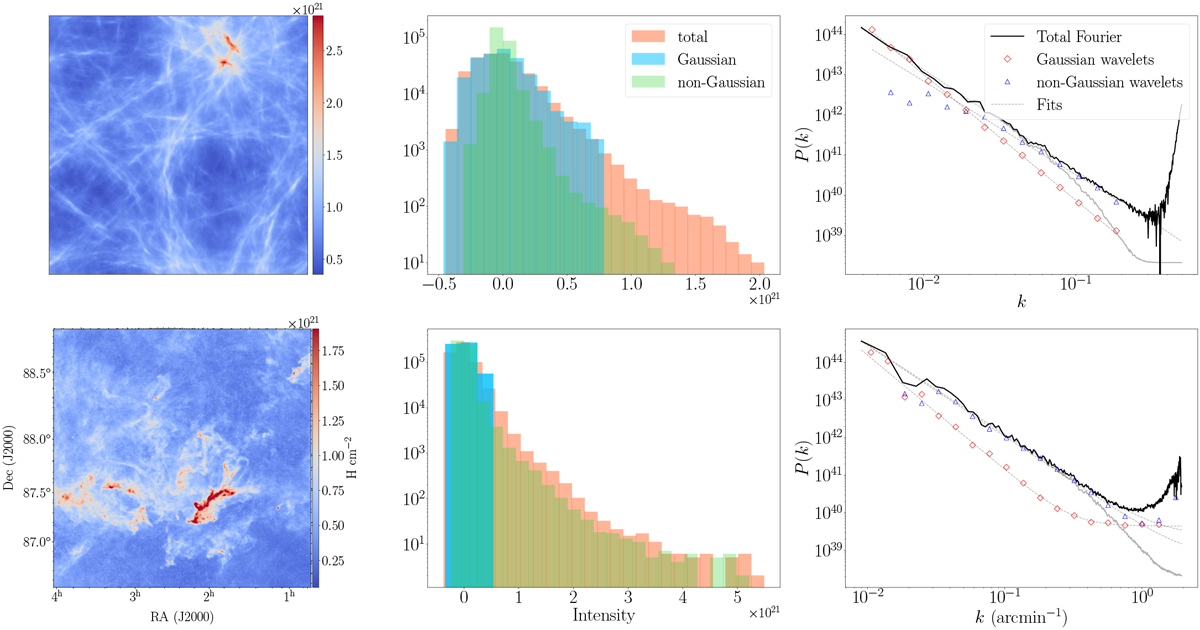
Top left panel: combined model, which is the addition of the fBm model in Fig. 1a and the directional modified random cascade model in Fig. 1d following Eq. (17). Top middle panel: its segmented PDFs. Top right panel: segmented power-spectra analysis. Bottom panels: same figures for the Polaris flare region that was previously analysed by Robitaille et al. (2019).
Current usage metrics show cumulative count of Article Views (full-text article views including HTML views, PDF and ePub downloads, according to the available data) and Abstracts Views on Vision4Press platform.
Data correspond to usage on the plateform after 2015. The current usage metrics is available 48-96 hours after online publication and is updated daily on week days.
Initial download of the metrics may take a while.