Fig. 3.
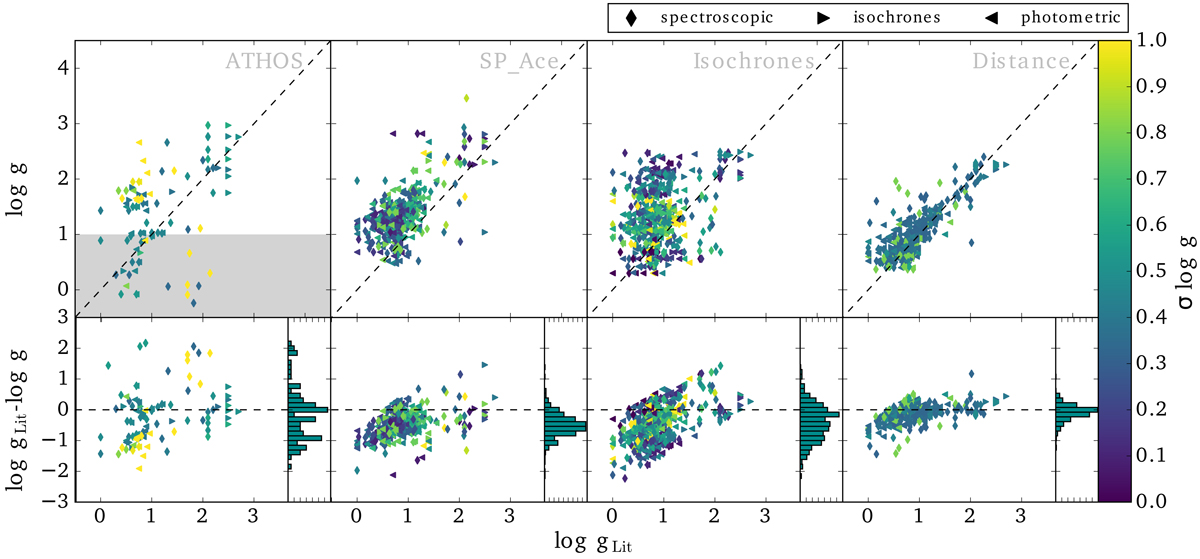
Comparison between literature surface gravities and our calculated values. Upper panels: surface gravity calculated using different methods versus the literature surface gravity. Symbols indicate the method that was used to derive the literature value and colors indicate the error of the here calculated value. Lower panels: difference between the here derived values and literature values together with a histogram. Shaded areas indicate regions where ATHOS is out of the trained range. We adopt surface gravities shown in the upper right panel based on distances to the respective galaxy.
Current usage metrics show cumulative count of Article Views (full-text article views including HTML views, PDF and ePub downloads, according to the available data) and Abstracts Views on Vision4Press platform.
Data correspond to usage on the plateform after 2015. The current usage metrics is available 48-96 hours after online publication and is updated daily on week days.
Initial download of the metrics may take a while.