Fig. 1
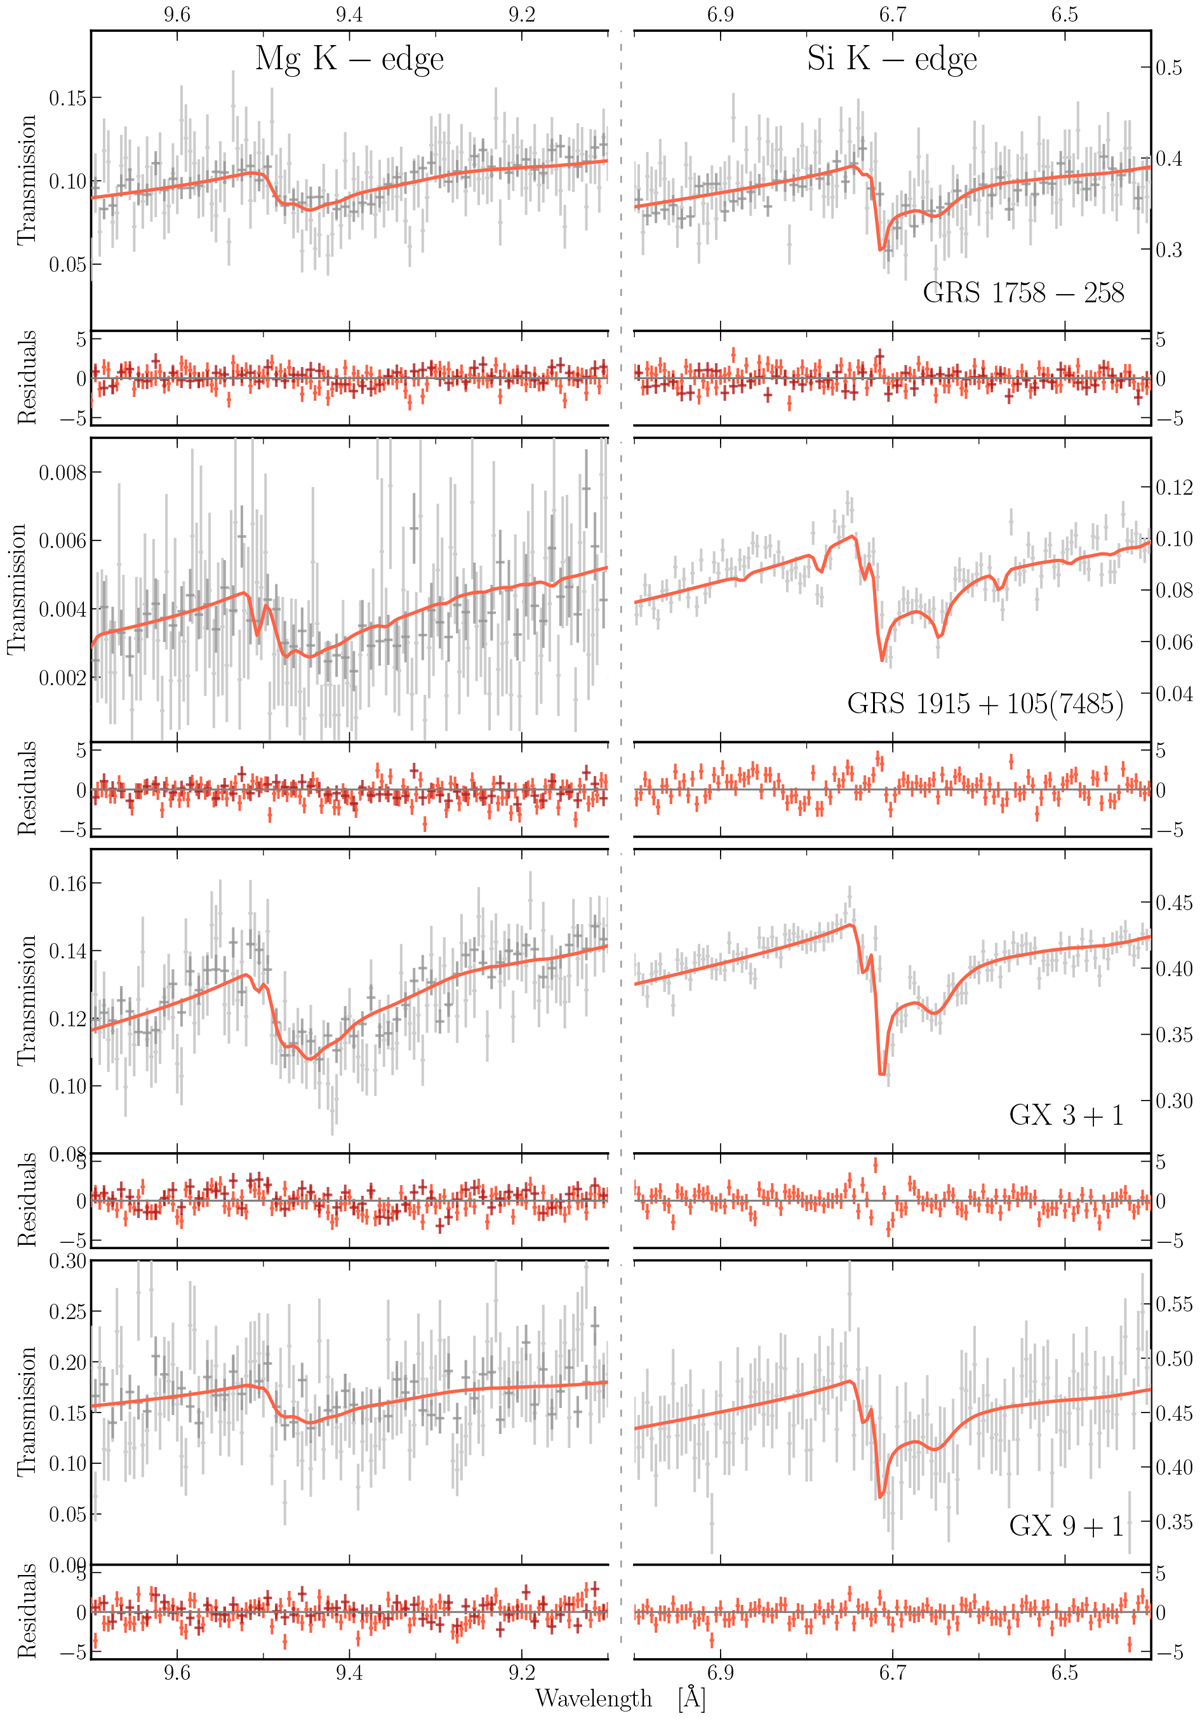
Zoom-in on the magnesium (in the left column) and silicon K-edge (in the right column). The HEG and MEGdata are respectively shown in light and dark grey. The solid red line represents the best fit whose dust composition is specified in Table 3. Bottom panels: residuals defined as (data − model)∕error. The data are stacked and binned for display purposes. For GRS 1915+105 we only display observation ID 7485, which also shows photoionisation lines (see Appendix A for further details).
Current usage metrics show cumulative count of Article Views (full-text article views including HTML views, PDF and ePub downloads, according to the available data) and Abstracts Views on Vision4Press platform.
Data correspond to usage on the plateform after 2015. The current usage metrics is available 48-96 hours after online publication and is updated daily on week days.
Initial download of the metrics may take a while.