Free Access
Fig. 4.
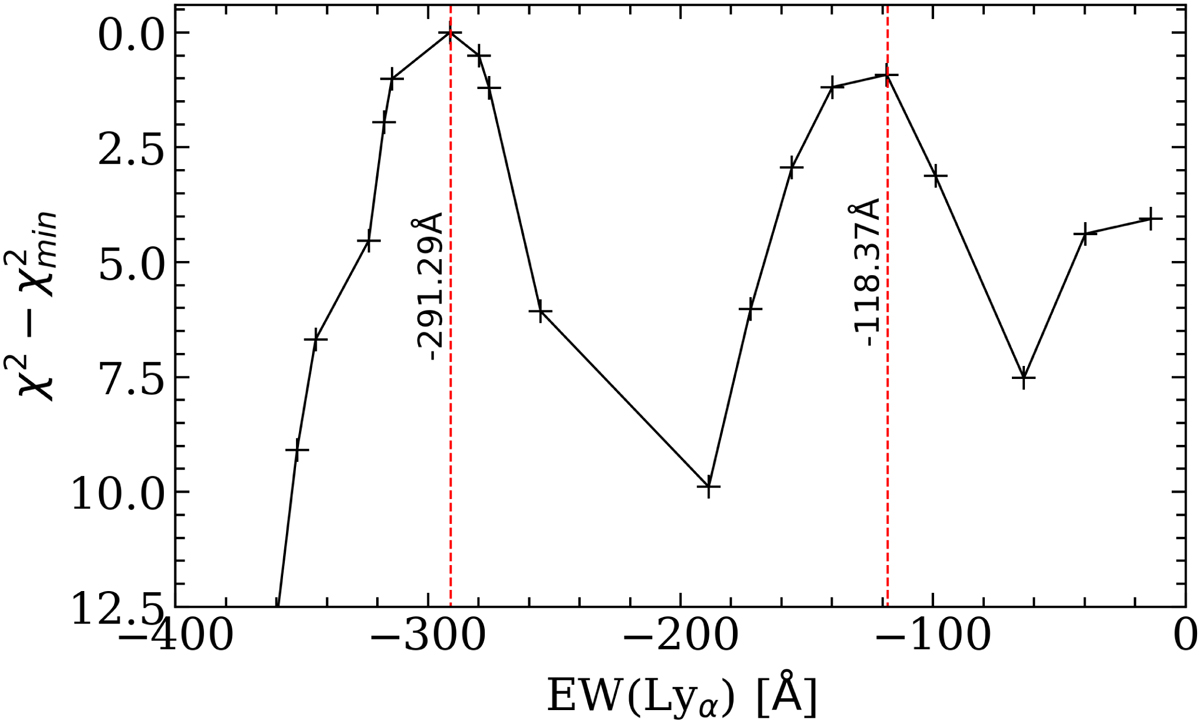
Attempt to estimate the equivalent width of Lyα based on the variation of the line ratios during SED fitting. The two vertical dashed lines give the position of the two local minima. The y-axis has been reversed for clarity and we choose the emission line to be negative.
Current usage metrics show cumulative count of Article Views (full-text article views including HTML views, PDF and ePub downloads, according to the available data) and Abstracts Views on Vision4Press platform.
Data correspond to usage on the plateform after 2015. The current usage metrics is available 48-96 hours after online publication and is updated daily on week days.
Initial download of the metrics may take a while.