Fig. 2.
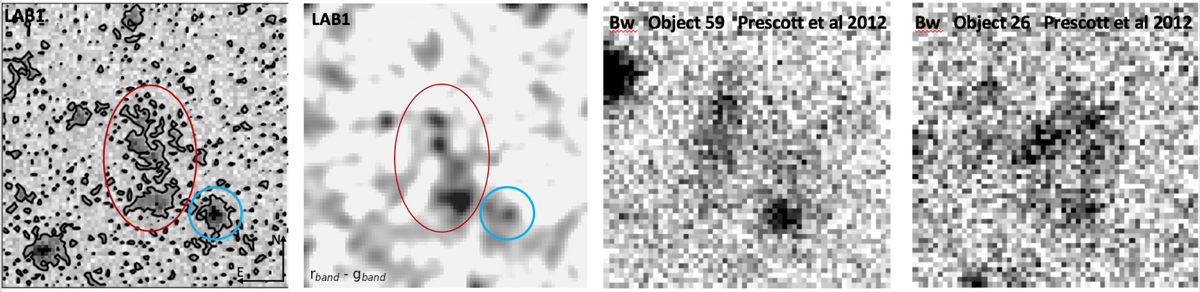
Left: contour of LAB1 on the 15″ × 15″ r-band image. North is up, east is left. The identified bright core is encircled in blue. The filamentary structure is encircled in red. The second image shows the r − g bands subtraction. The third image is the Bw-band of object 59 of Prescott et al. (2012). Right: Bw-band of object 26 of Prescott et al. (2012). Both Bw-band stamps were extracted from Fig. 10 of Prescott et al. (2012).
Current usage metrics show cumulative count of Article Views (full-text article views including HTML views, PDF and ePub downloads, according to the available data) and Abstracts Views on Vision4Press platform.
Data correspond to usage on the plateform after 2015. The current usage metrics is available 48-96 hours after online publication and is updated daily on week days.
Initial download of the metrics may take a while.