Free Access
Fig. 3.
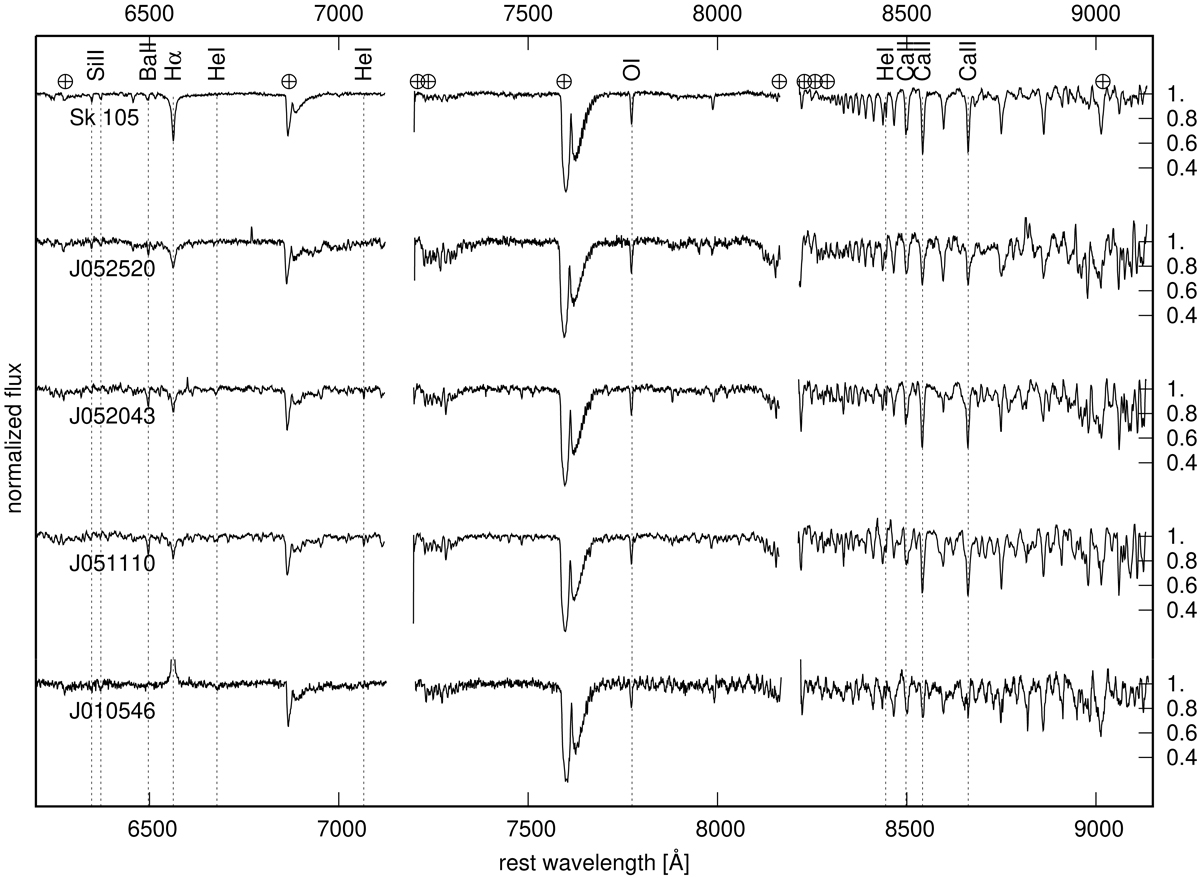
Spectra of the absorption line or featureless objects in the red setting. The spectra were normalised to continuum. A constant offset of 1.2 was applied between the adjacent spectra. Vertical dashed lines indicate the rest wavelengths of the indicated absorption lines.
Current usage metrics show cumulative count of Article Views (full-text article views including HTML views, PDF and ePub downloads, according to the available data) and Abstracts Views on Vision4Press platform.
Data correspond to usage on the plateform after 2015. The current usage metrics is available 48-96 hours after online publication and is updated daily on week days.
Initial download of the metrics may take a while.