Fig. 2.
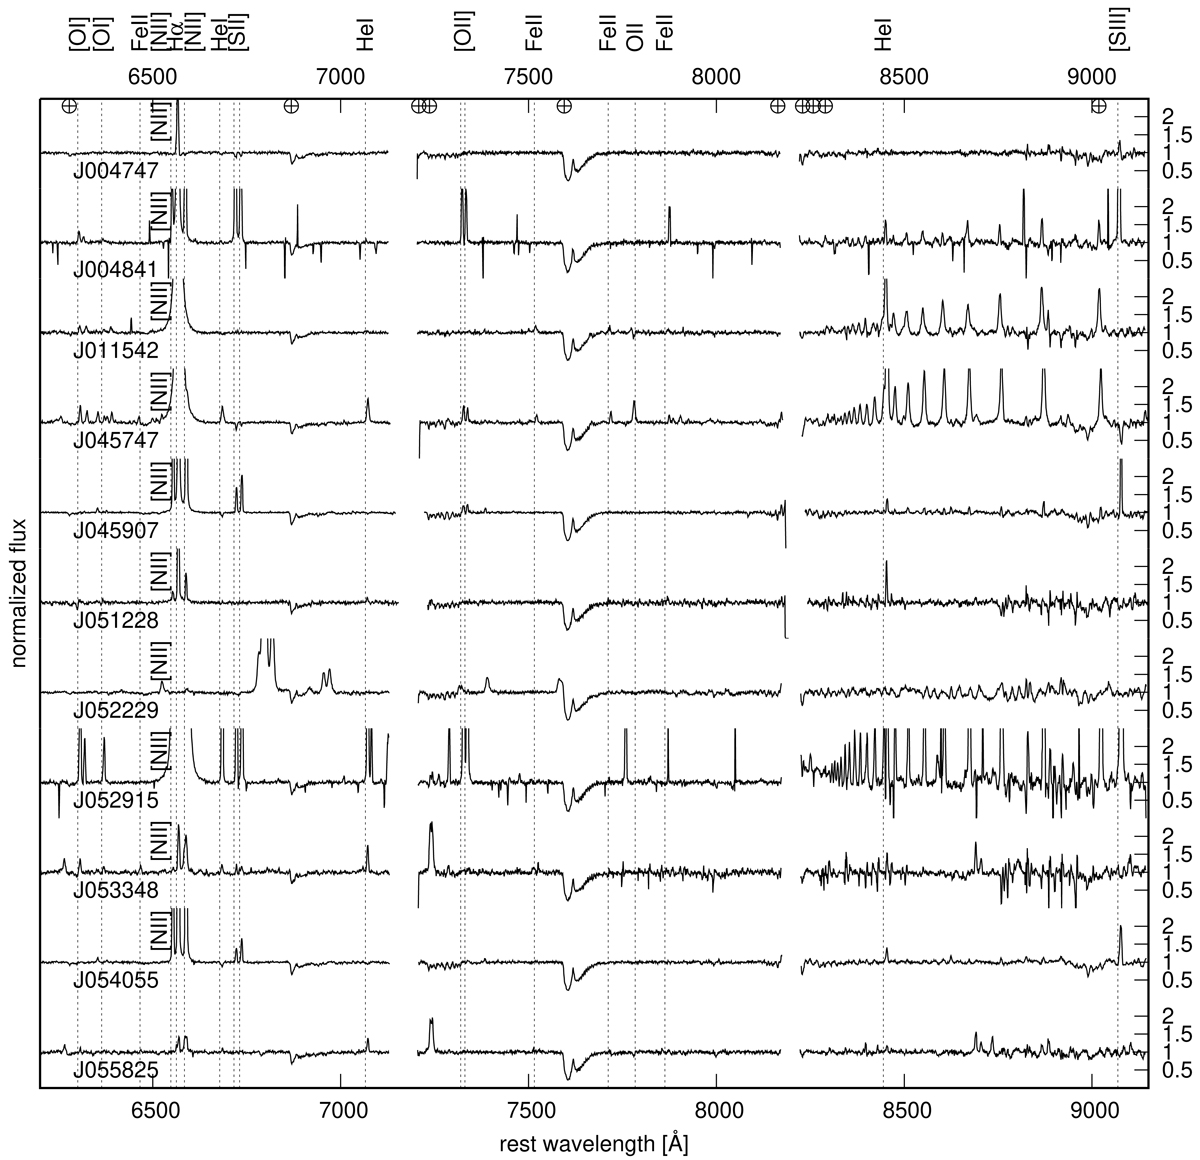
Red spectra of the objects showing emission lines or emission and absorption lines. The spectra were normalised to continuum. A constant offset of 2.5 was applied between the adjacent spectra. Telluric lines are indicated by wheel cross symbols at the top of the plot. Vertical dashed lines give rest wavelength of the indicated emission lines. For clarity, lines representing Fe II emissions are not described.
Current usage metrics show cumulative count of Article Views (full-text article views including HTML views, PDF and ePub downloads, according to the available data) and Abstracts Views on Vision4Press platform.
Data correspond to usage on the plateform after 2015. The current usage metrics is available 48-96 hours after online publication and is updated daily on week days.
Initial download of the metrics may take a while.