Fig. A.4.
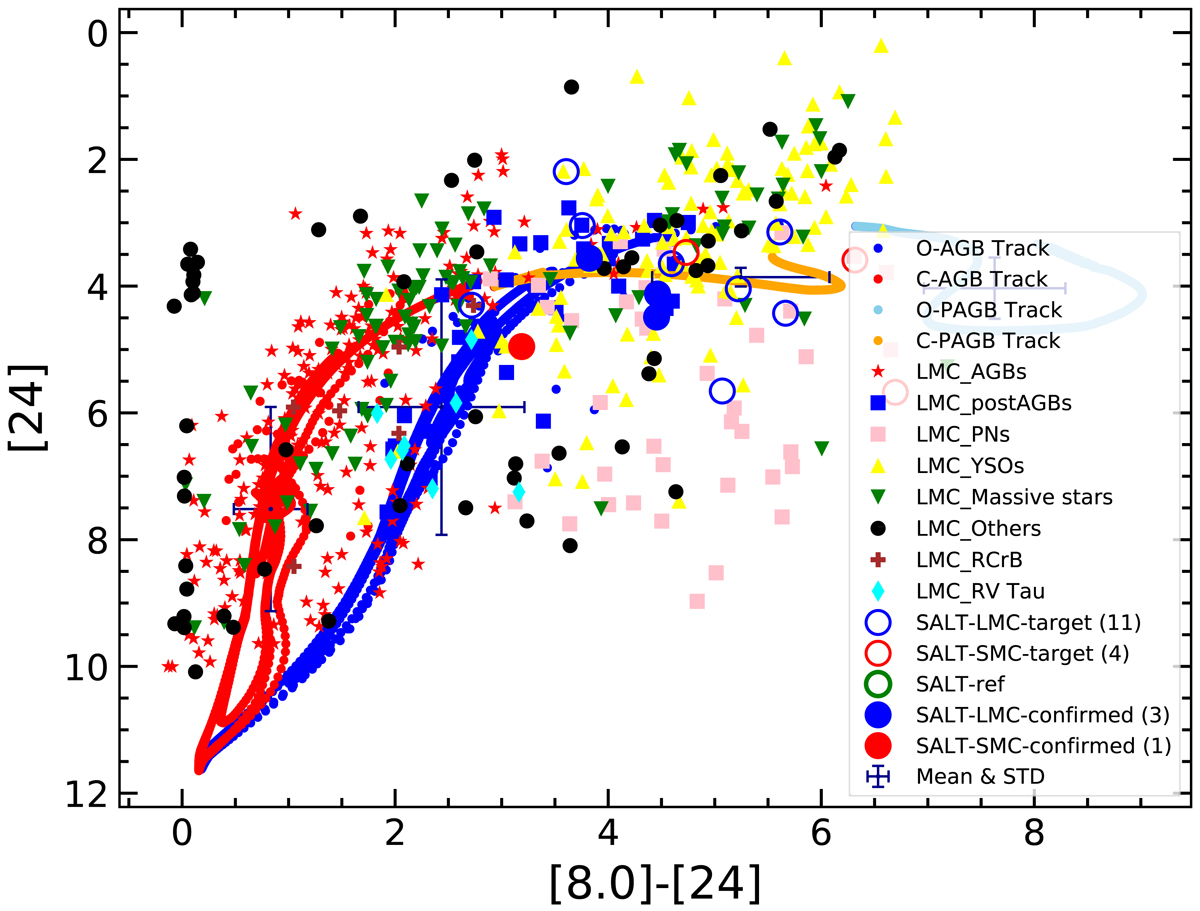
Colour–magnitude diagram [24.0] vs. [8.0]–[24]. The selected targets for SALT observations are indicated by circles: black (LMC), red (SMC), and green (SK 105). The confirmed post-AGB objects (No. 3, 7, 9, and 11) are plotted as filled circles and are located within 3 < [8.0]–[24] < 5 and 3> [24]> 5, which can be compared with Fig. 6 of Blum et al. (2006).
Current usage metrics show cumulative count of Article Views (full-text article views including HTML views, PDF and ePub downloads, according to the available data) and Abstracts Views on Vision4Press platform.
Data correspond to usage on the plateform after 2015. The current usage metrics is available 48-96 hours after online publication and is updated daily on week days.
Initial download of the metrics may take a while.