Fig. 13.
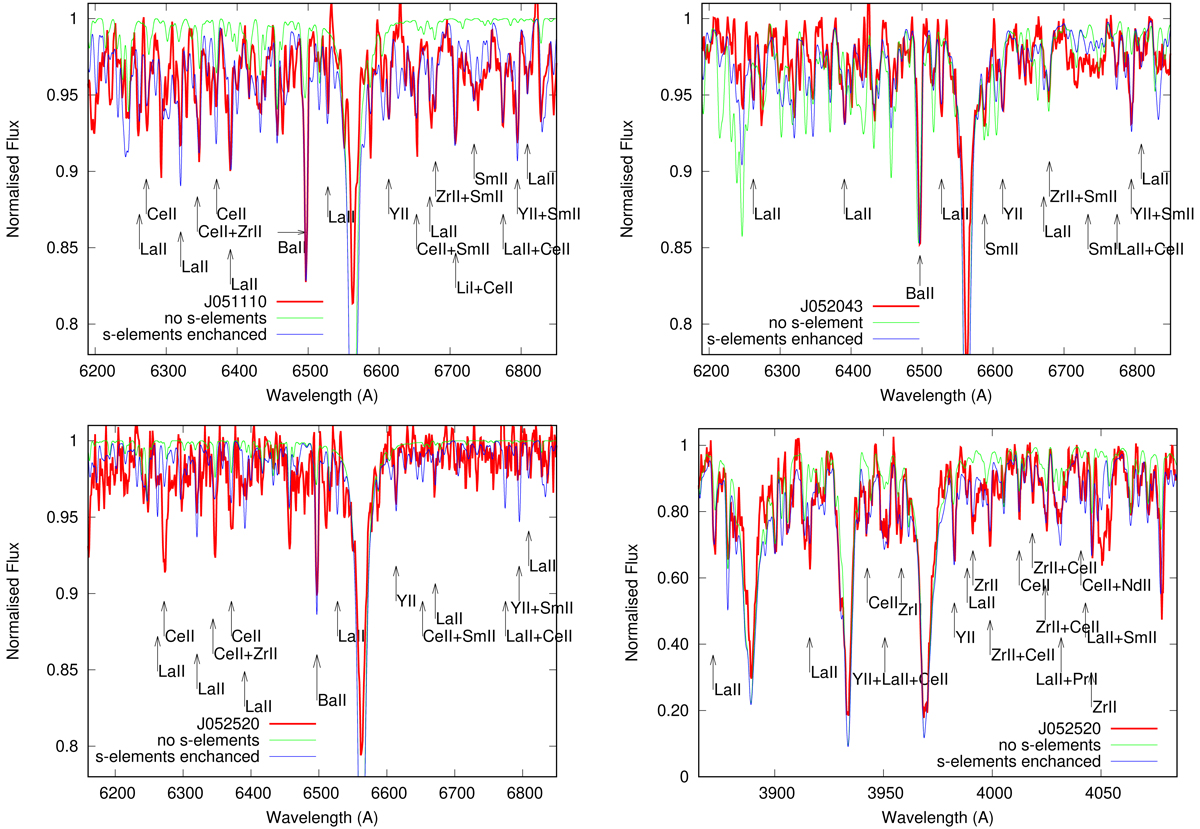
Best fit of synthetic spectra with enhanced abundances of s-elements to the observed spectra of J051110 (top left), J052043 (top right), J052520 (bottom left), and blue spectrum of J052520 (bottom right). The fit with s-process elements enhanced to the spectrum of J052043 required a reduction in abundances of Ti and Fe of −0.5 dex.
Current usage metrics show cumulative count of Article Views (full-text article views including HTML views, PDF and ePub downloads, according to the available data) and Abstracts Views on Vision4Press platform.
Data correspond to usage on the plateform after 2015. The current usage metrics is available 48-96 hours after online publication and is updated daily on week days.
Initial download of the metrics may take a while.