Free Access
Fig. 1.
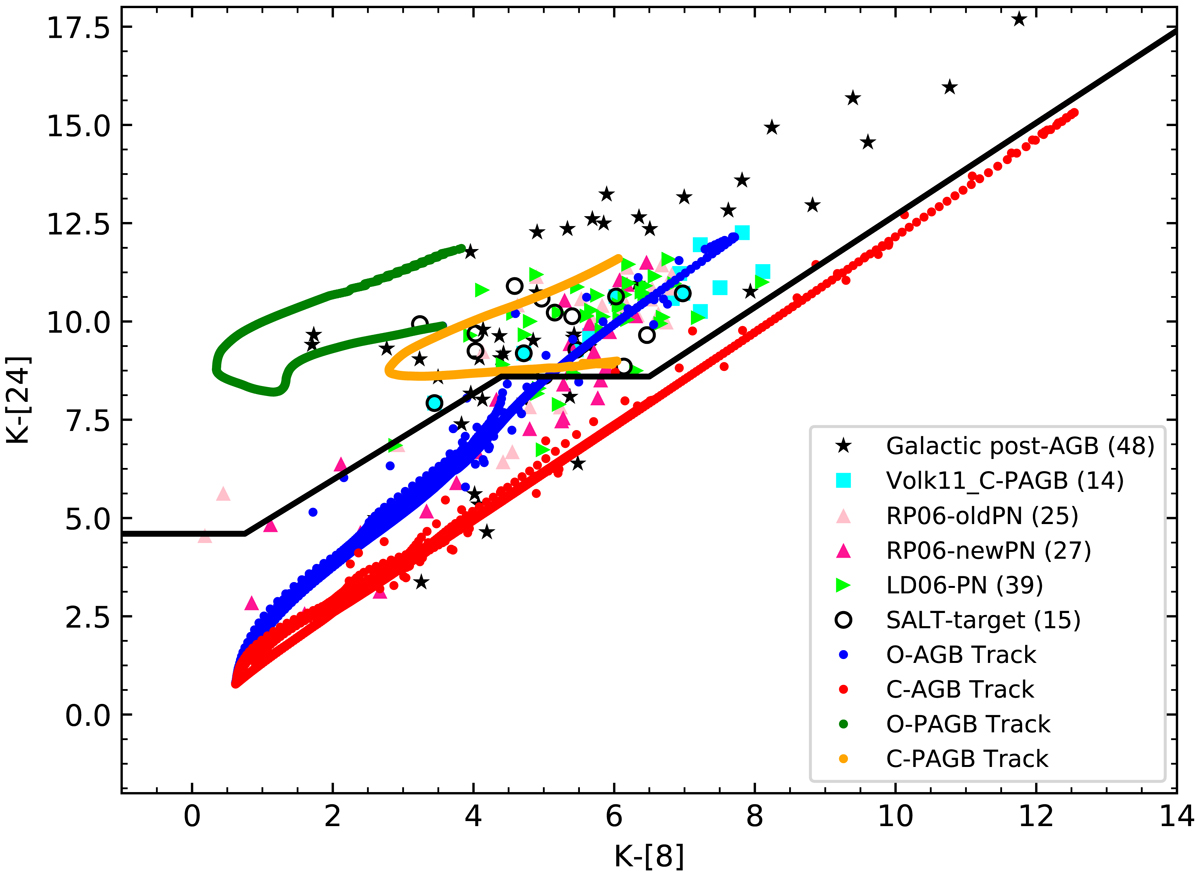
Colour–colour diagram used for the selection of the post-AGB candidates. The main post-AGB candidate area is above the black lines. The numbers in parentheses in the inset list the total number of each class of objects plotted in this figure (see text for details).
Current usage metrics show cumulative count of Article Views (full-text article views including HTML views, PDF and ePub downloads, according to the available data) and Abstracts Views on Vision4Press platform.
Data correspond to usage on the plateform after 2015. The current usage metrics is available 48-96 hours after online publication and is updated daily on week days.
Initial download of the metrics may take a while.