Open Access
Fig. 9.
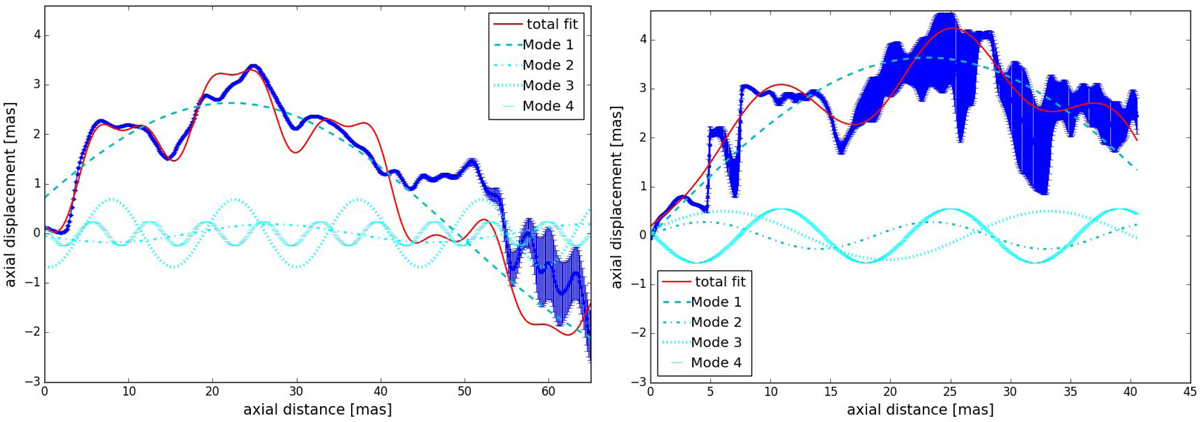
Fits by oscillatory modes to the jet ridge lines in the ground- (left) and space- (right) VLBI images of S5 0836+710 at 1.6 GHz. In each plot, the red line is the total multi-mode fit and the blue lines represent contributions from the individual oscillatory modes as described in the legend.
Current usage metrics show cumulative count of Article Views (full-text article views including HTML views, PDF and ePub downloads, according to the available data) and Abstracts Views on Vision4Press platform.
Data correspond to usage on the plateform after 2015. The current usage metrics is available 48-96 hours after online publication and is updated daily on week days.
Initial download of the metrics may take a while.