Fig. 8.
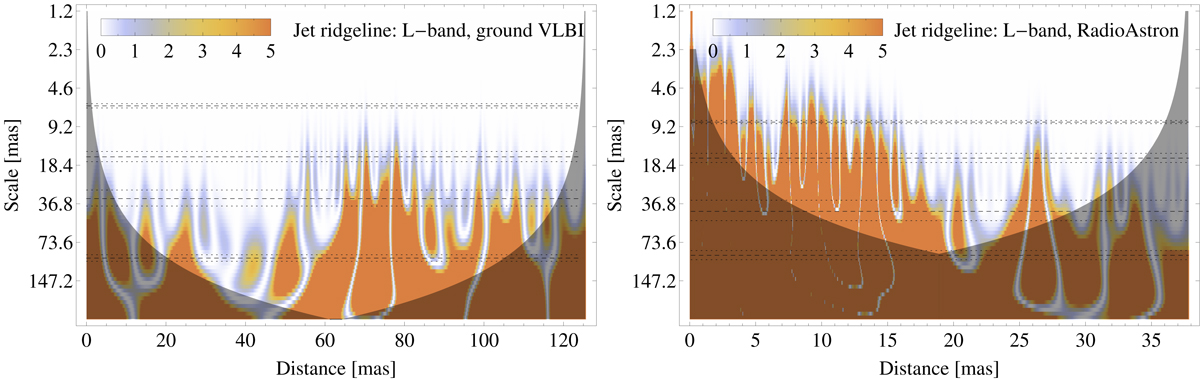
Wavelet scalograms for the ridge lines of S5 0836+710 at 1.6 GHz, obtained from the ground- (left) and space-VLBI (right) images. Color presents the wavelet amplitude scaled with the mean error, σpos, of the ridge line position measurements. The color scale is saturated at 5σpos level for better viewing. Undersampled regions of the parameter space are shaded. For both ridge lines, the scalogram is dominated by an oscillation with a long wavelength of ∼90–100 mas, although it cannot be well sampled with the ridge line from the space-VLBI image. Presence of one or more oscillatory patterns with wavelengths of ∼25–45 mas can also be suggested from both scalograms. A mode with the wavelength of ∼10–15 mas can be inferred from the space-VLBI ridge line. For the purpose of comparison, each scalogram also shows the wavelengths (dashed lines) and respective uncertainties (dotted lines) of the oscillatory modes fitted to represent the ridge lines as described in Sect. 4.2. For each of these wavelengths, the respective scalogram contains at least one region of statistically significant wavelet amplitudes, thus reaffirming the physical relevance of the fitted oscillatory modes.
Current usage metrics show cumulative count of Article Views (full-text article views including HTML views, PDF and ePub downloads, according to the available data) and Abstracts Views on Vision4Press platform.
Data correspond to usage on the plateform after 2015. The current usage metrics is available 48-96 hours after online publication and is updated daily on week days.
Initial download of the metrics may take a while.