Open Access
Fig. 3.
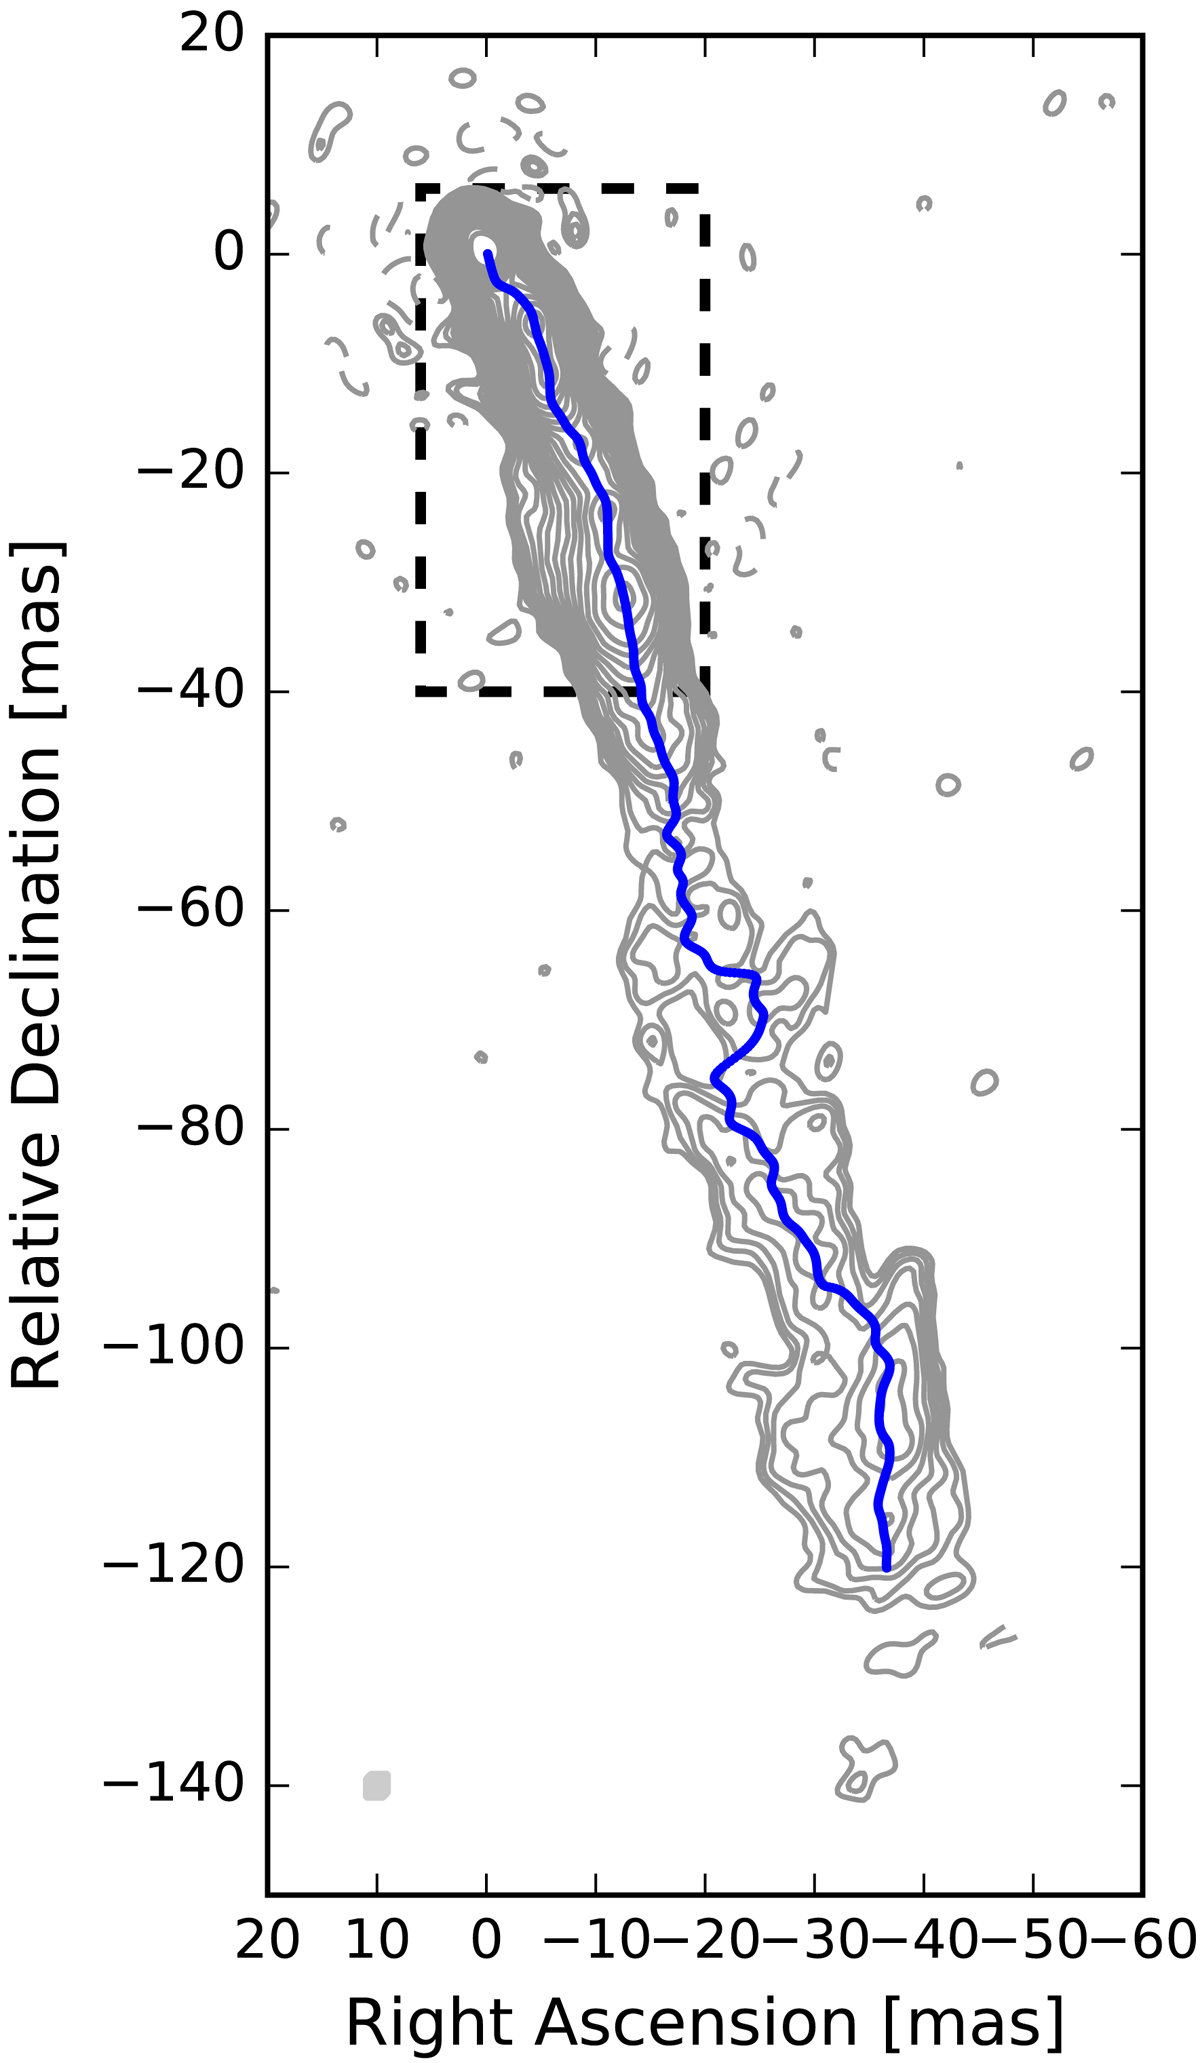
Ground VLBI image of S5 0836+710 at 1.6 GHz. Contours are drawn at (−1, 1, ![]() , 2, etc.) times 0.32 mJy beam−1. Image parameters are listed in Table 3. The dashed box marks the area covered by the respective RadioAstron image shown in Fig. 4. The curved blue line denotes the jet ridge line derived and discussed in Sect. 4.
, 2, etc.) times 0.32 mJy beam−1. Image parameters are listed in Table 3. The dashed box marks the area covered by the respective RadioAstron image shown in Fig. 4. The curved blue line denotes the jet ridge line derived and discussed in Sect. 4.
Current usage metrics show cumulative count of Article Views (full-text article views including HTML views, PDF and ePub downloads, according to the available data) and Abstracts Views on Vision4Press platform.
Data correspond to usage on the plateform after 2015. The current usage metrics is available 48-96 hours after online publication and is updated daily on week days.
Initial download of the metrics may take a while.