Fig. 49.
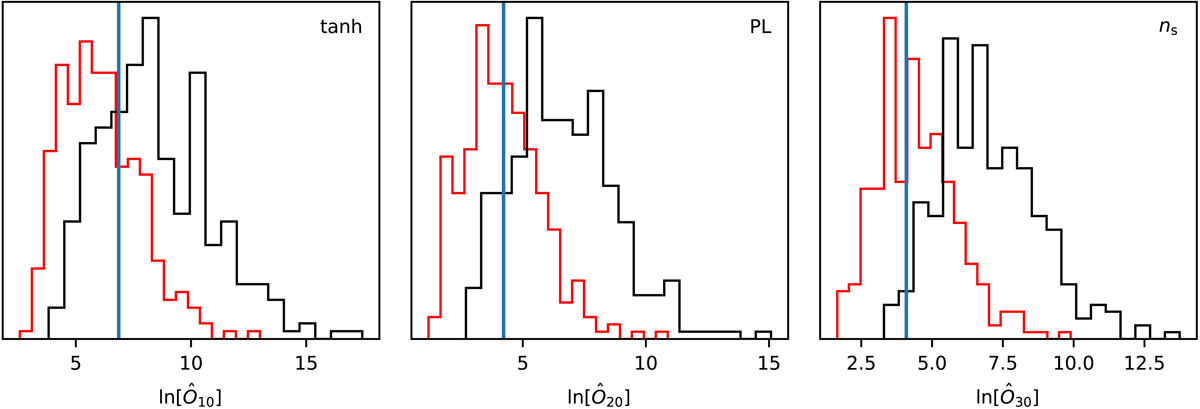
Histograms of the quantity ![]() for the tanh, power-law, and ns gradient modulation models using Planck temperature data combined with 300 statistically isotropic polarization simulations (red outlines) or 300 polarization simulations modulated according to the best-fit parameters from the temperature data (black). The blue lines indicate the values for the actual SMICA polarization data. A large value relative to the isotropic (red) simulations would indicate that the modulation model is preferred over ΛCDM.
for the tanh, power-law, and ns gradient modulation models using Planck temperature data combined with 300 statistically isotropic polarization simulations (red outlines) or 300 polarization simulations modulated according to the best-fit parameters from the temperature data (black). The blue lines indicate the values for the actual SMICA polarization data. A large value relative to the isotropic (red) simulations would indicate that the modulation model is preferred over ΛCDM.
Current usage metrics show cumulative count of Article Views (full-text article views including HTML views, PDF and ePub downloads, according to the available data) and Abstracts Views on Vision4Press platform.
Data correspond to usage on the plateform after 2015. The current usage metrics is available 48-96 hours after online publication and is updated daily on week days.
Initial download of the metrics may take a while.