Fig. 46.
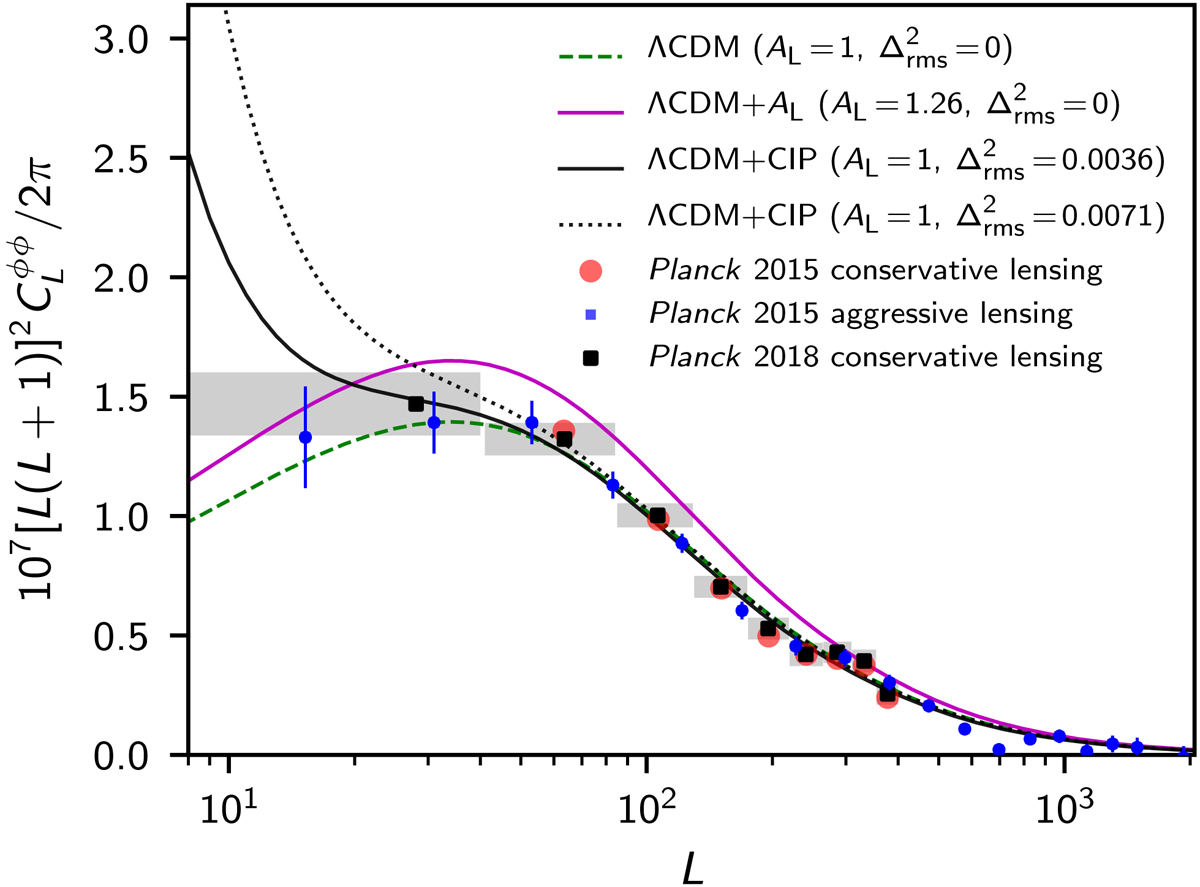
Conservative Planck 2015 lensing data (red points), aggressive Planck 2015 lensing data (blue points with error bars), and conservative Planck 2018 lensing data (black squares in grey boxes), along with the best-fit models to the Planck data: the best-fit adiabatic ΛCDM model to 2018 TT+lowE (green dashed line); the best-fit ΛCDM+AL model to 2018 TT+lowE (magenta solid line, AL = 1.26); and the best-fit ΛCDM+CIP model to 2018 TT,TE,EE+lowE and conservative lensing data (black solid line, ![]() ) and to 2015 TT,TE,EE+lowP and conservative lensing data (black dotted line,
) and to 2015 TT,TE,EE+lowP and conservative lensing data (black dotted line, ![]() ). As CIP modifies only the very low-L part of the lensing power spectrum, the conservative 2015 lensing data (40 ≤ L ≤ 400) are insensitive to CIP even when
). As CIP modifies only the very low-L part of the lensing power spectrum, the conservative 2015 lensing data (40 ≤ L ≤ 400) are insensitive to CIP even when ![]() . On the other hand, the first two data points of the 2015 aggressive lensing data disfavour the large CIP amplitude (Smith et al. 2017), which gives a very good fit to all the other data. Planck 2018 conservative lensing data cover the range 8 ≤ L ≤ 400 and consequently disfavour CIP variances
. On the other hand, the first two data points of the 2015 aggressive lensing data disfavour the large CIP amplitude (Smith et al. 2017), which gives a very good fit to all the other data. Planck 2018 conservative lensing data cover the range 8 ≤ L ≤ 400 and consequently disfavour CIP variances ![]() .
.
Current usage metrics show cumulative count of Article Views (full-text article views including HTML views, PDF and ePub downloads, according to the available data) and Abstracts Views on Vision4Press platform.
Data correspond to usage on the plateform after 2015. The current usage metrics is available 48-96 hours after online publication and is updated daily on week days.
Initial download of the metrics may take a while.