Fig. 43.
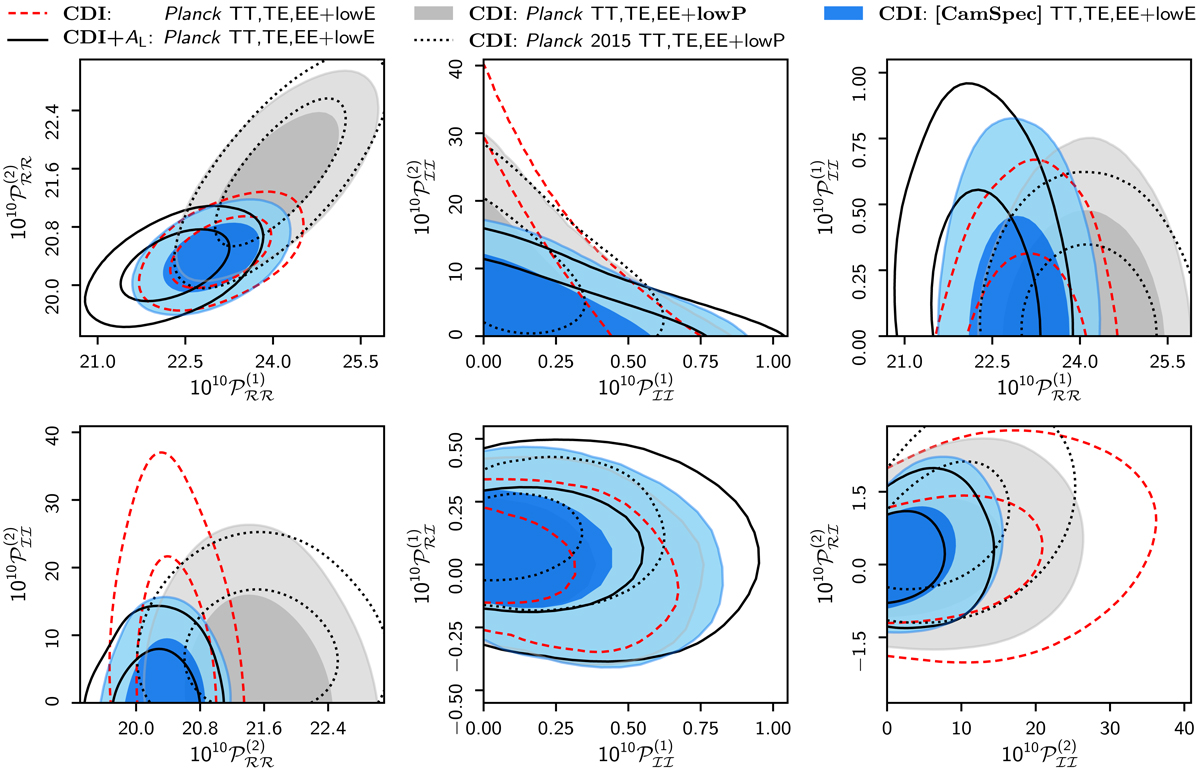
Comparison of the effect of Planck 2018 likelihood choices and phenomenological lensing amplitude, AL, on the constraints on the generally correlated mixed adiabatic and CDI model. The reference case, indicated by the red dashed curves, is for the 2018 baseline Plik high-ℓ likelihood supplemented by the low-ℓ Commander TT likelihood and the low-ℓ SimAll EE likelihood. This combination is the same as in Fig. 39a (red curves), except now without the lensing likelihood, which to some extent hides the differences between other likelihoods and the effect of AL. Black solid contours show the results using the same likelihood as in the reference case, but now for the mixed adiabatic and CDI model when simultaneously allowing AL to vary. The remaining two curves are for the mixed adiabatic and CDI model (with AL = 1), but now changing the low-ℓ likelihood from Commander TT+SimAll EE to LFI 70-GHz T,E,B (grey), or high-ℓ likelihood from Plik to CamSpec (blue).
Current usage metrics show cumulative count of Article Views (full-text article views including HTML views, PDF and ePub downloads, according to the available data) and Abstracts Views on Vision4Press platform.
Data correspond to usage on the plateform after 2015. The current usage metrics is available 48-96 hours after online publication and is updated daily on week days.
Initial download of the metrics may take a while.