Open Access
Fig. 35.
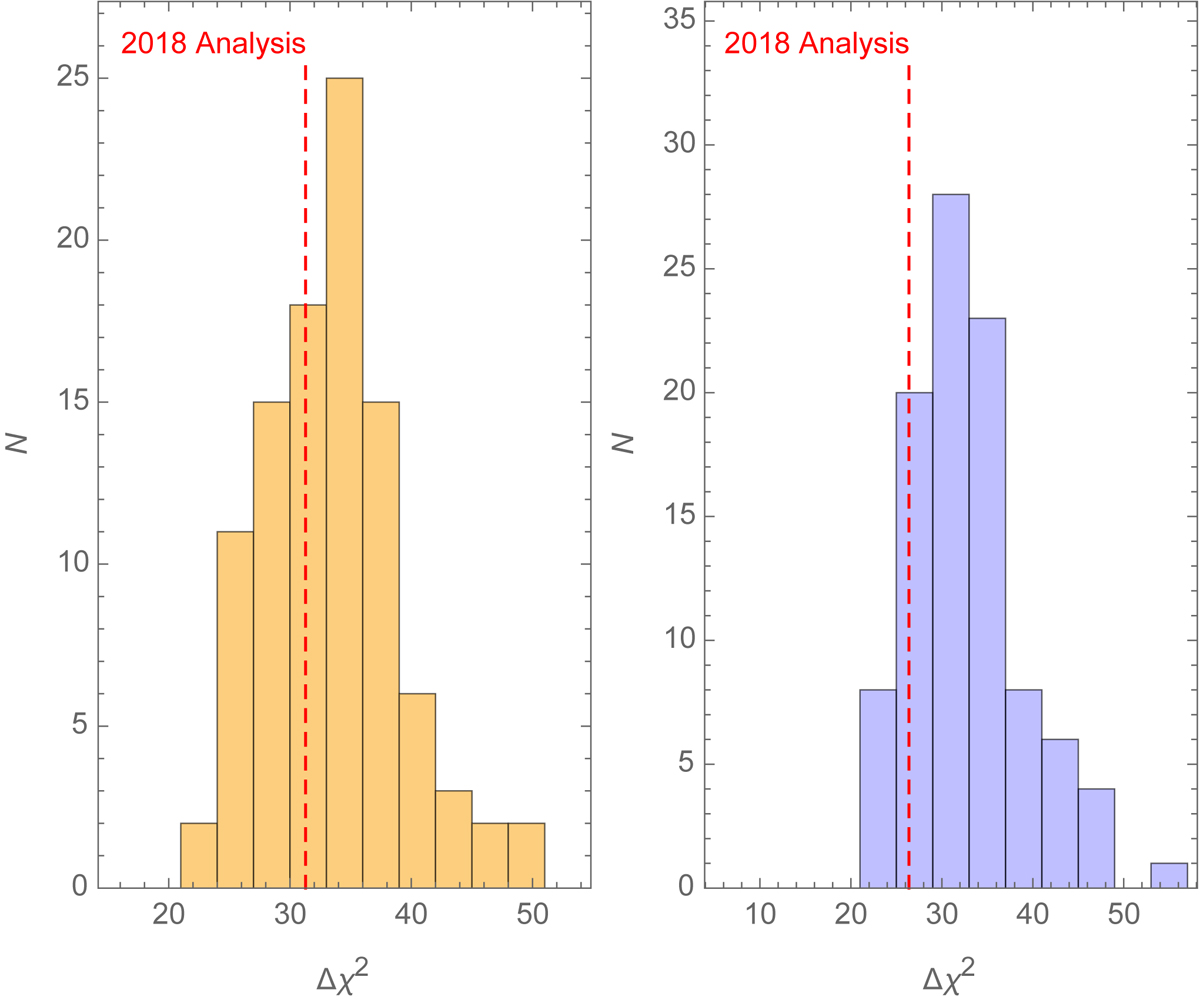
Typical best-fit improvement in units of Δχ2 in 100 simulations compared to the real data (red dashed lines) for the log feature (left) and the linear feature (right) models.
Current usage metrics show cumulative count of Article Views (full-text article views including HTML views, PDF and ePub downloads, according to the available data) and Abstracts Views on Vision4Press platform.
Data correspond to usage on the plateform after 2015. The current usage metrics is available 48-96 hours after online publication and is updated daily on week days.
Initial download of the metrics may take a while.