Fig. 31.
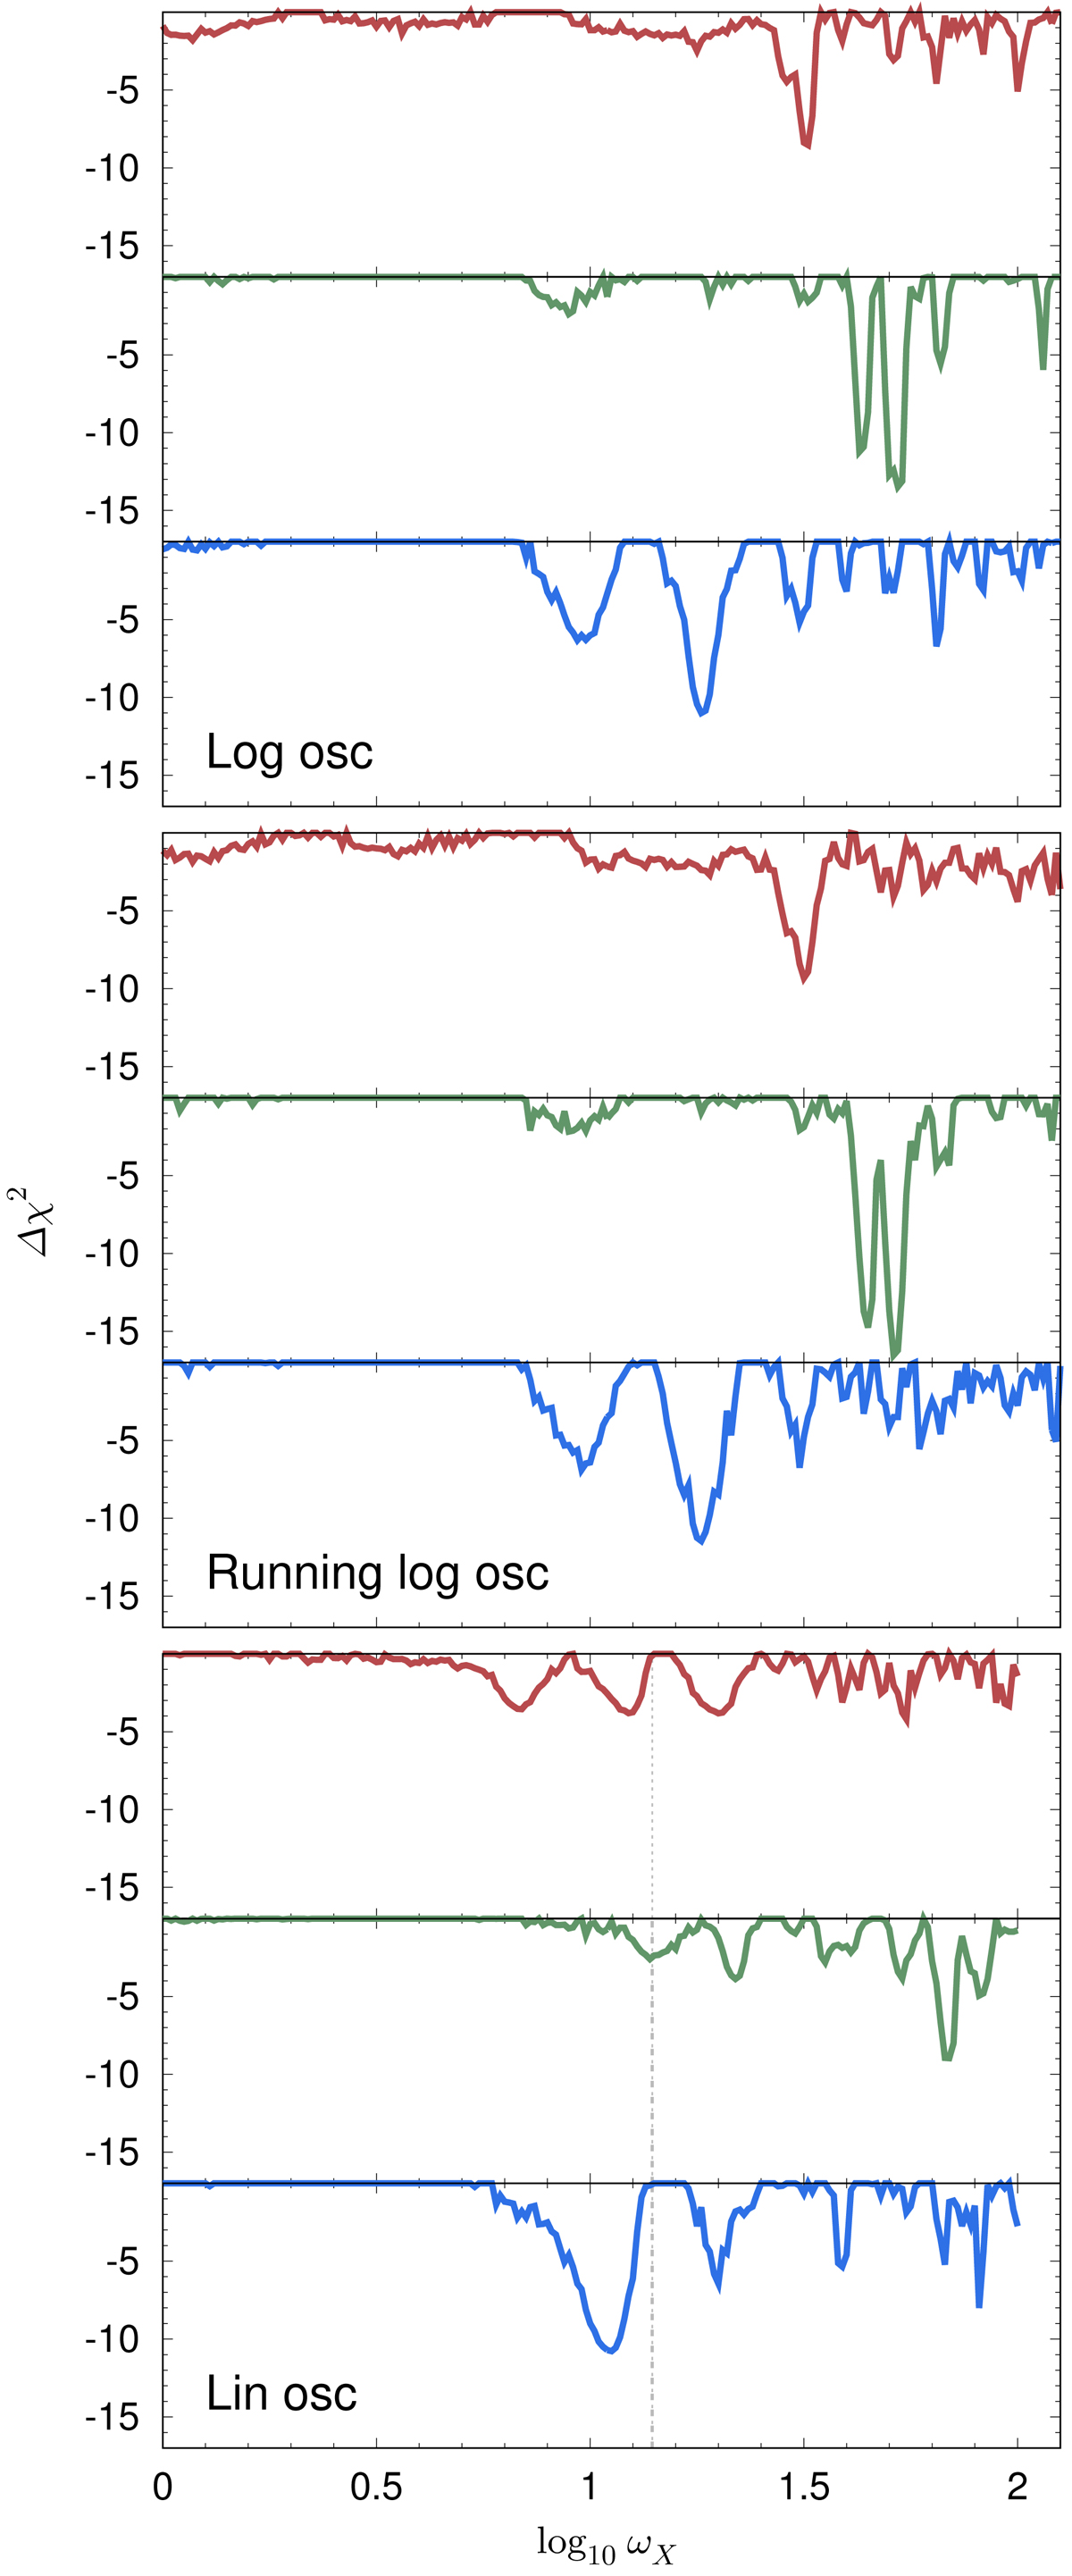
Profile likelihood of the frequency parameter in the three oscillatory feature models for TT (red curves), EE (green), and TT,TE,EE data (blue). The dotted grey line in the bottom panels marks the frequency for which the linear oscillation model leads to a modulation of the angular power spectra whose wavelength roughly matches that of the CMB’s acoustic oscillations. Note the lack of alignment between the temperature and polarization likelihood peaks in the vicinity of this frequency.
Current usage metrics show cumulative count of Article Views (full-text article views including HTML views, PDF and ePub downloads, according to the available data) and Abstracts Views on Vision4Press platform.
Data correspond to usage on the plateform after 2015. The current usage metrics is available 48-96 hours after online publication and is updated daily on week days.
Initial download of the metrics may take a while.