Fig. 30.
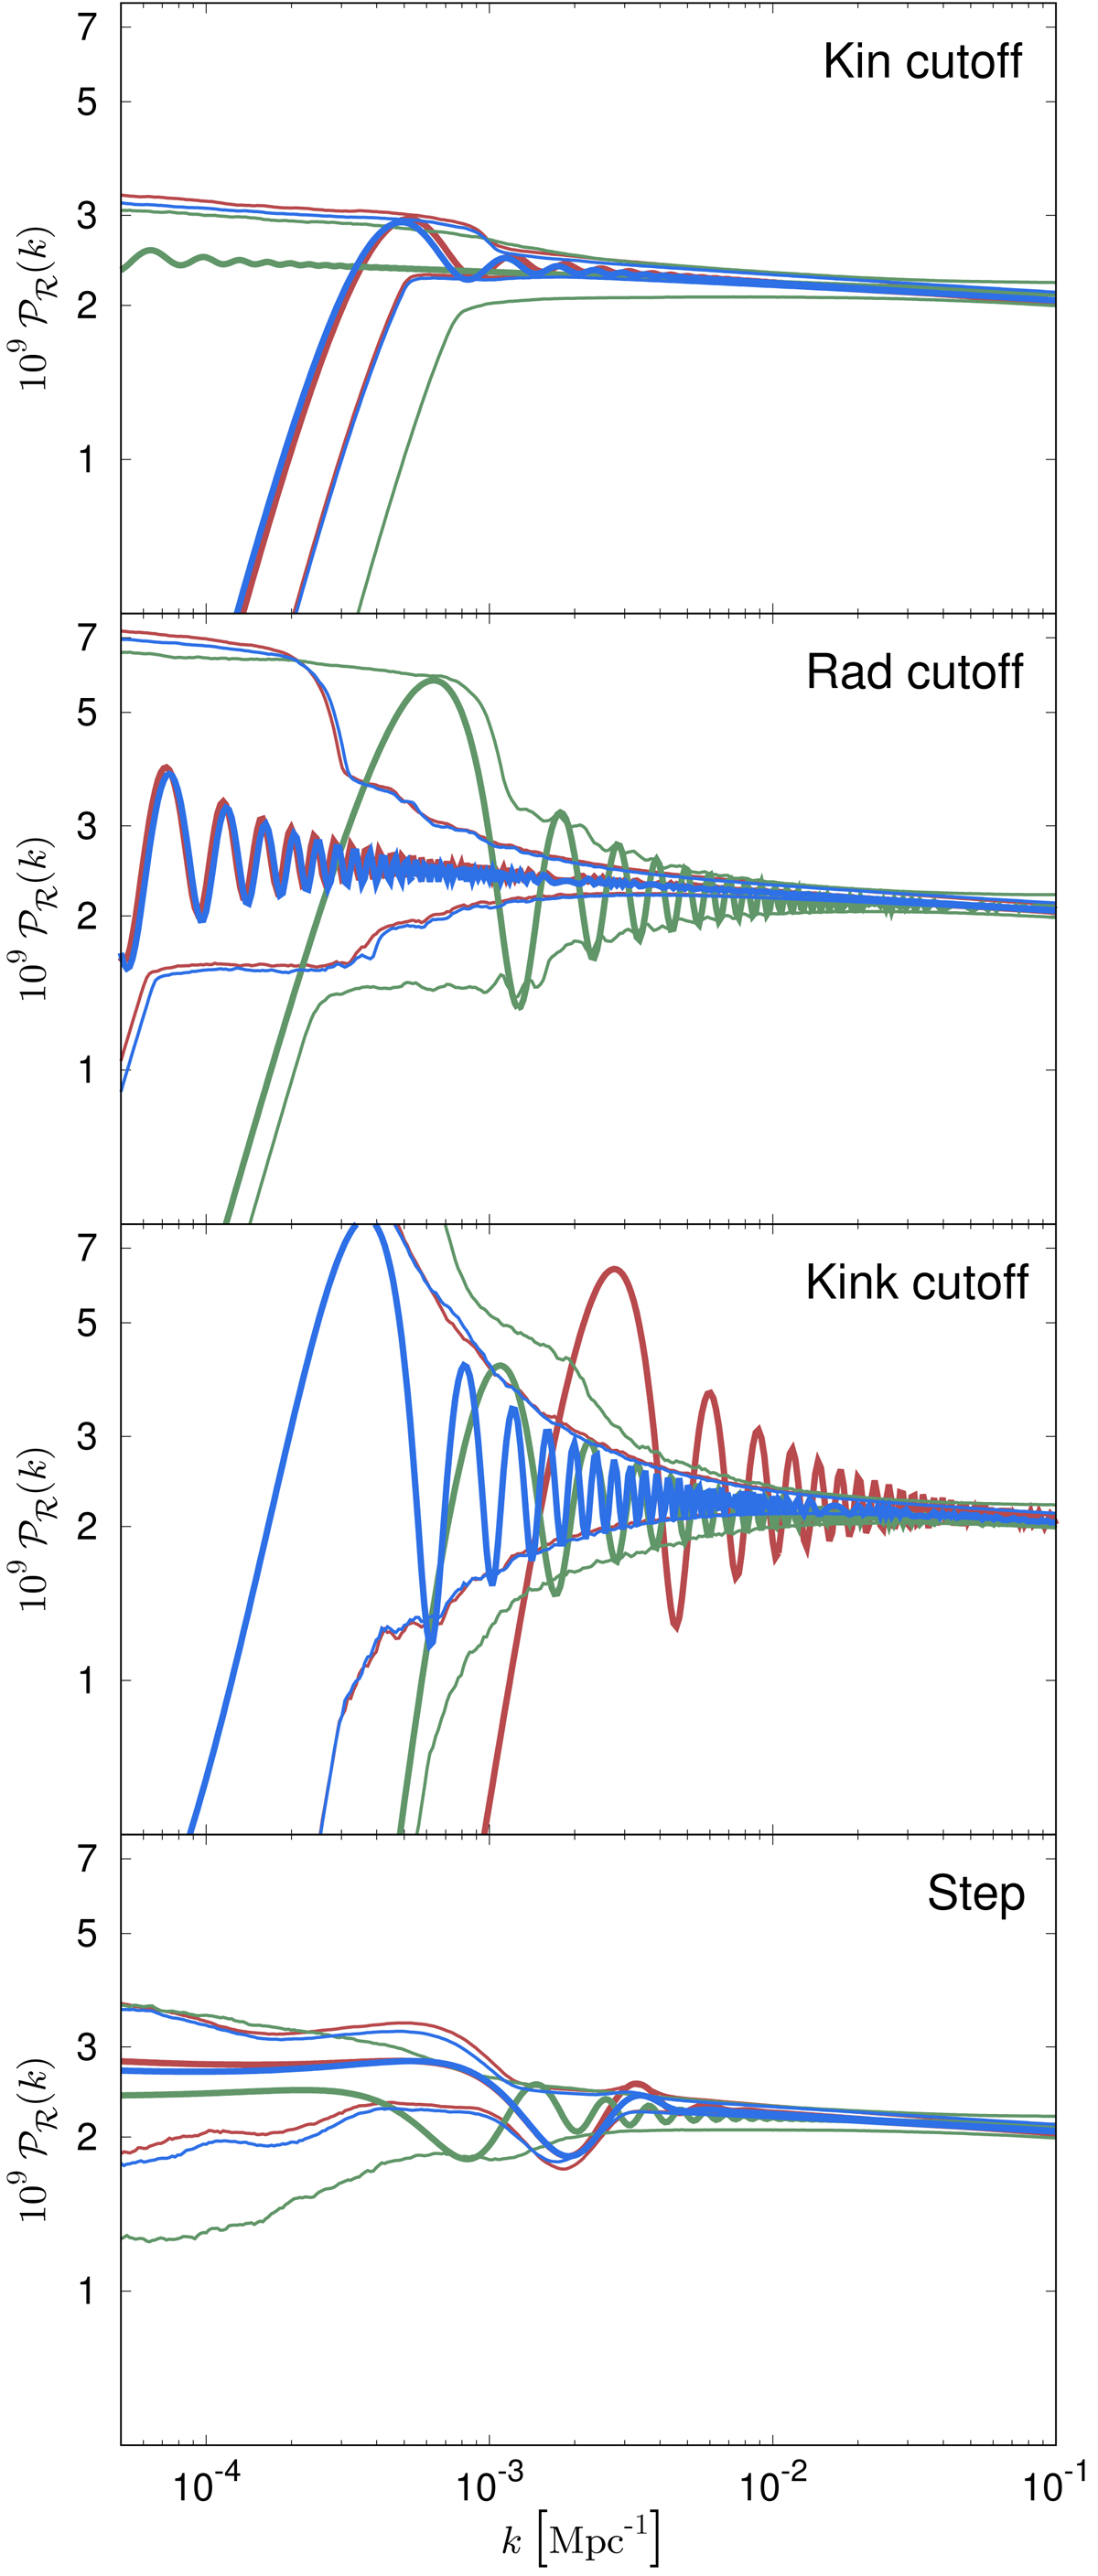
Best-fit and central 95% CL regions for the primordial power spectrum in the three cutoff and the step models for TT data (red curves), EE data (green), and TT,TE,EE data (blue). Note that for the combination of kink cutoff model and TT data, the best-fit value for the cutoff scale ![]() lies close to the prior boundary, and therefore the best-fit spectrum does not fall within the central 95%-credible band.
lies close to the prior boundary, and therefore the best-fit spectrum does not fall within the central 95%-credible band.
Current usage metrics show cumulative count of Article Views (full-text article views including HTML views, PDF and ePub downloads, according to the available data) and Abstracts Views on Vision4Press platform.
Data correspond to usage on the plateform after 2015. The current usage metrics is available 48-96 hours after online publication and is updated daily on week days.
Initial download of the metrics may take a while.