Fig. 27.
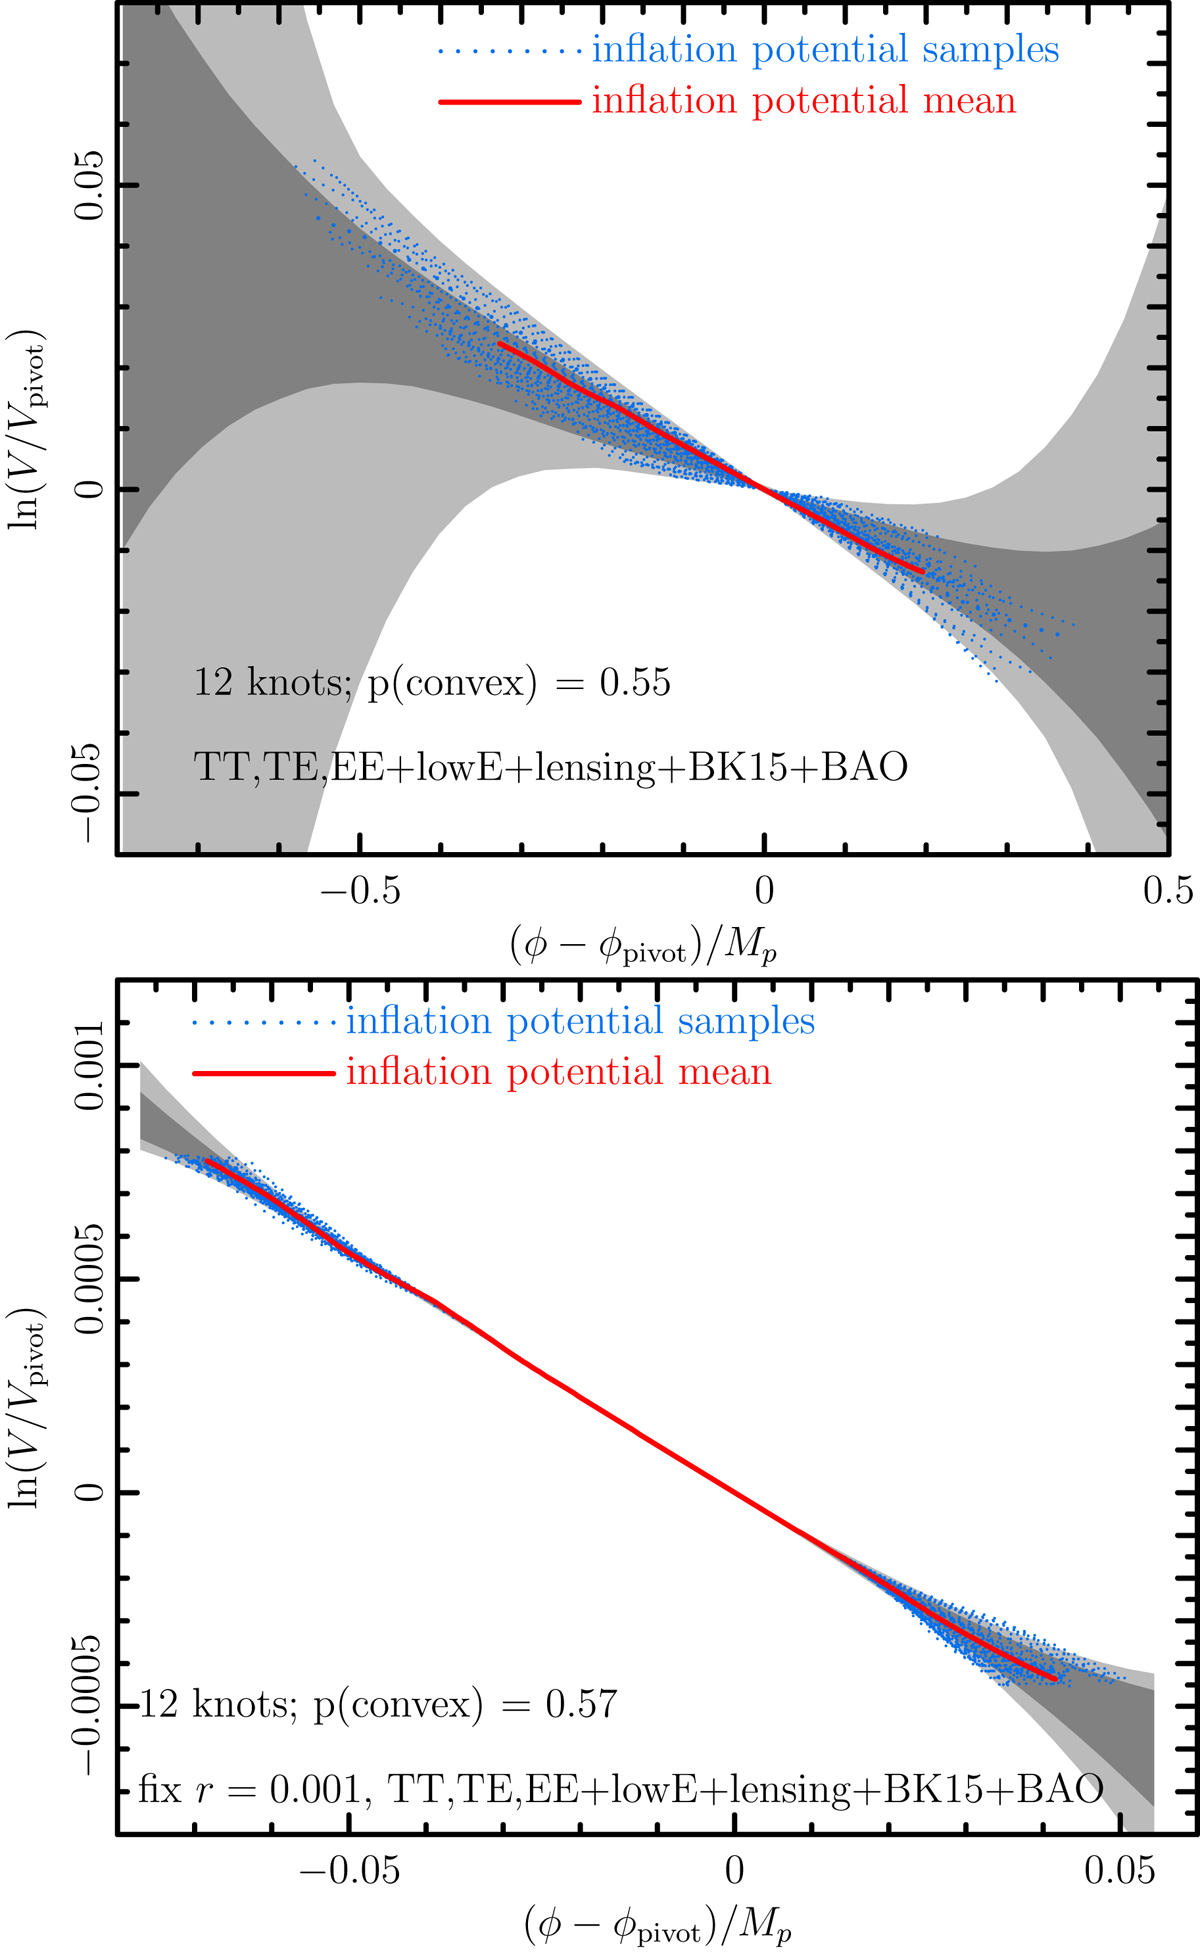
Top: reconstructed shape of the single-field inflaton potential from the cubic-spline power spectra mode-expansion using 12 knots and the Planck TT,TE,EE+lowE+lensing+BK15+BAO data. Bottom: result when r is fixed at 0.001. Instead of plotting as a function of wavenumber k we plot lnV(ϕ)/Vpivot about a pivot field value ϕpivot. Note that the range on the ϕ axis is quite different for the small r case than the floating case. The probability of local convexity evaluated at ϕpivot is denoted as p(convex).
Current usage metrics show cumulative count of Article Views (full-text article views including HTML views, PDF and ePub downloads, according to the available data) and Abstracts Views on Vision4Press platform.
Data correspond to usage on the plateform after 2015. The current usage metrics is available 48-96 hours after online publication and is updated daily on week days.
Initial download of the metrics may take a while.