Fig. 18.
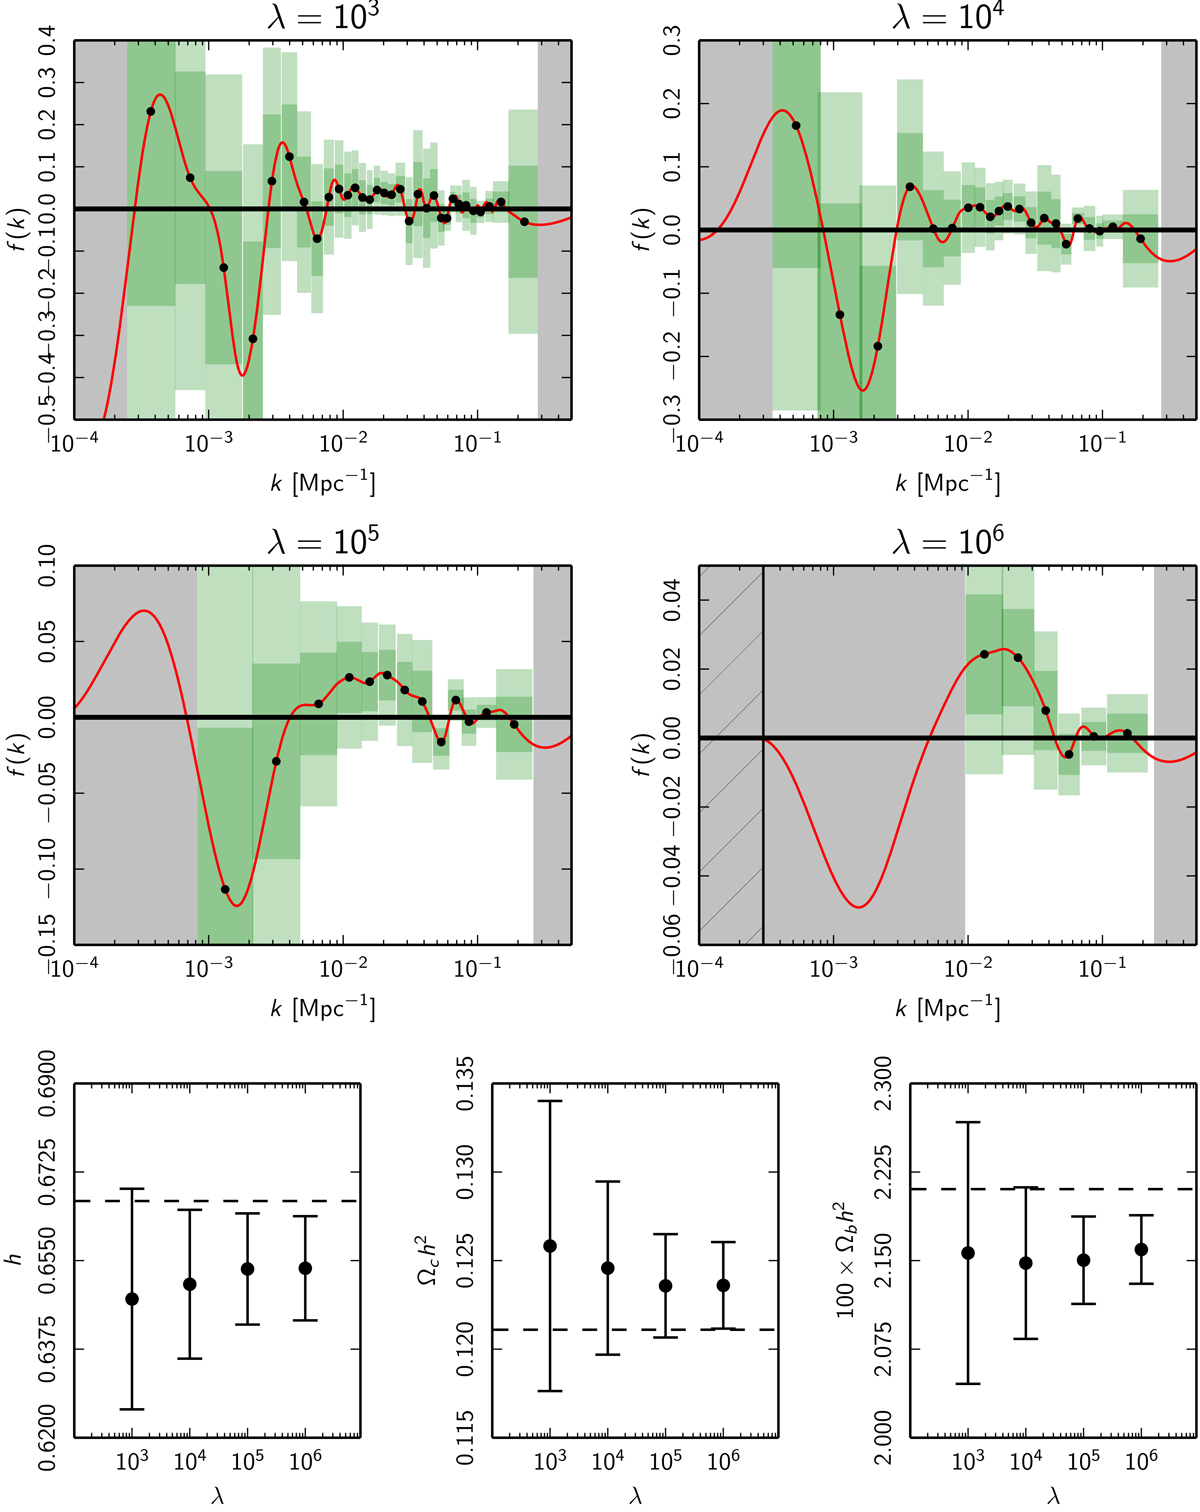
Planck TT+lowE penalized likelihood primordial power spectrum reconstruction. Top four panels: deviation f(k) for four different roughness penalties. The red curves indicate the best-fit deviation, while the vertical extents of the dark and light green error bars indicate the ±1σ and ±2σ errors, respectively. The width of the error bars indicates the minimum reconstructible width (the minimum width for a Gaussian feature such that the mean square deviation of the reconstruction is less than 10%). The grey regions display where the minimum reconstructible width is undefined, meaning that the reconstruction in these regions is untrustworthy. The hatched region in the λ = 106 plot indicates where the fixing penalty has been applied. Lower three panels: ±1σ error bars for the three non-primordial-specctrum cosmological parameters included in the reconstruction. The respective best-fit fiducial model values are indicated by the dashed lines.
Current usage metrics show cumulative count of Article Views (full-text article views including HTML views, PDF and ePub downloads, according to the available data) and Abstracts Views on Vision4Press platform.
Data correspond to usage on the plateform after 2015. The current usage metrics is available 48-96 hours after online publication and is updated daily on week days.
Initial download of the metrics may take a while.