Fig. 7.
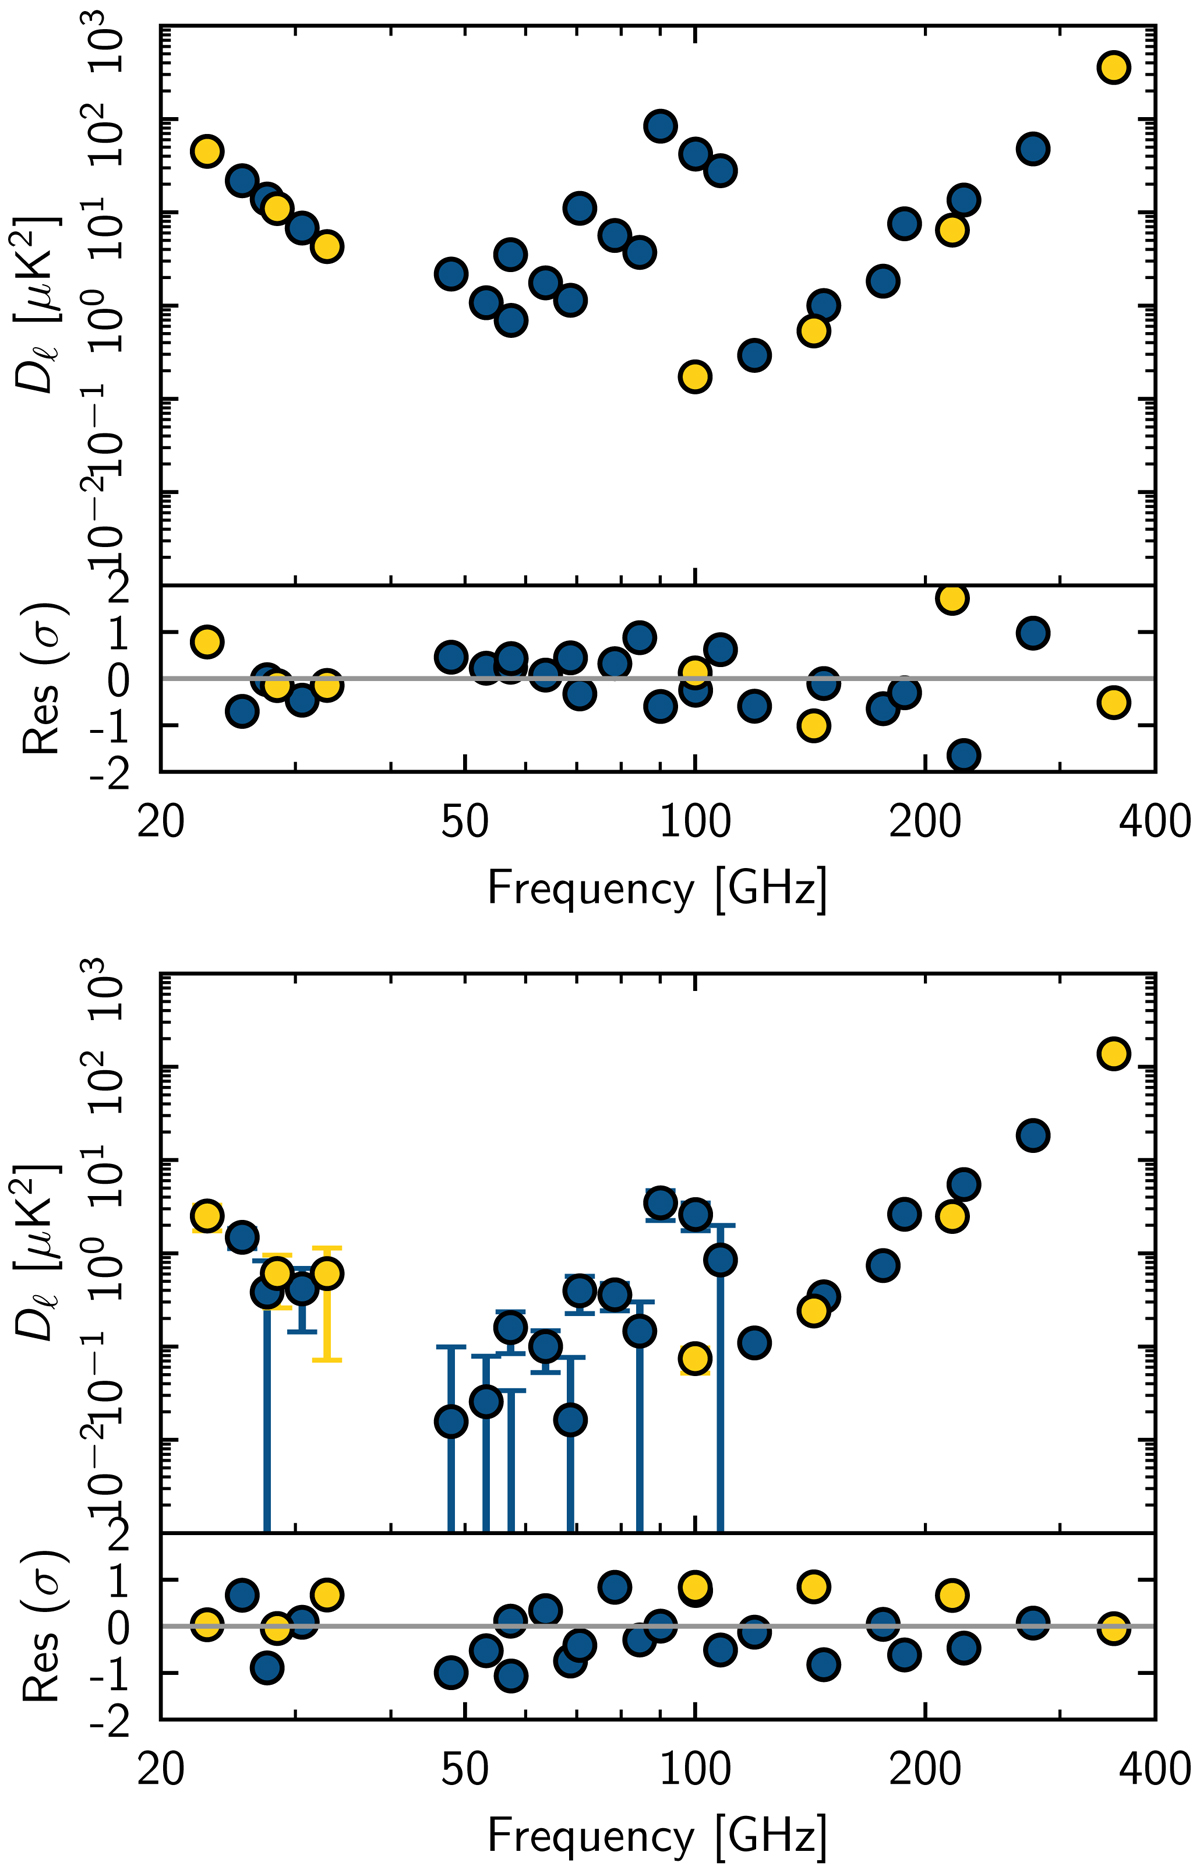
BB cross-spectra 𝒟ℓ(ν1 × ν2) versus the effective frequency νeff = (ν1 × ν2)0.5, for the LR62 sky region and two multipole bins: ℓ = 4-11 (top plot) and 40–59 (bottom). Yellow and blue colours represent data values from single and inter-frequency cross spectra, respectively. Bottom panel: within each plot shows the residuals from the fits normalized to the 1 σ uncertainty of each data point. Lower frequency data (left) points are dominated by the SED of synchrotron polarized emission, while higher frequency (right) data characterize dust polarized emission, and those at the centre characterize the correlation between the two sources of emission. Differences between the two plots illustrate that both the ratio between synchrotron and dust power and the correlation between these two sources of polarized emission decrease for increasing multipoles.
Current usage metrics show cumulative count of Article Views (full-text article views including HTML views, PDF and ePub downloads, according to the available data) and Abstracts Views on Vision4Press platform.
Data correspond to usage on the plateform after 2015. The current usage metrics is available 48-96 hours after online publication and is updated daily on week days.
Initial download of the metrics may take a while.