Fig. 4.
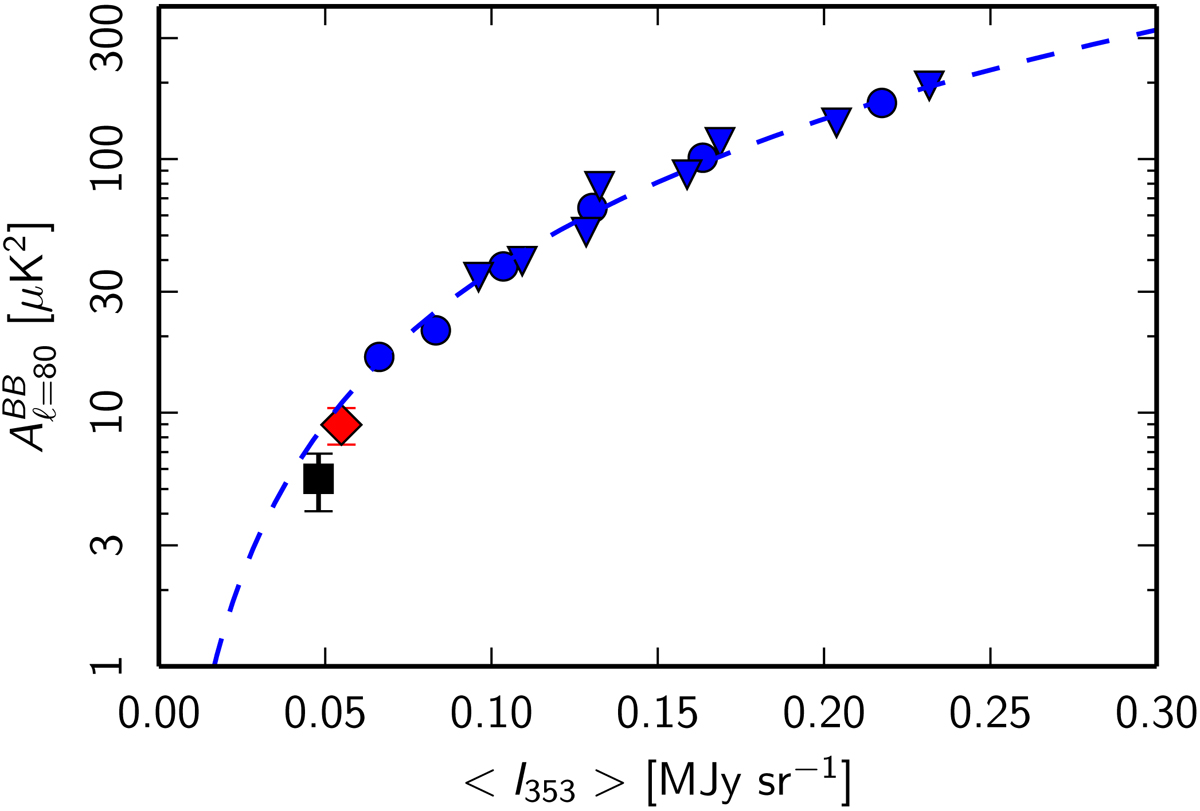
Scaling of the BB power at ℓ = 80 versus the mean dust total intensity at 353 GHz. The dashed black line is a power-law fit to values for the six sky regions in our analysis (blue dots) with an exponent of two. Also shown are the values for the N–S splits of the regions in Fig. 3 (blue triangles). These results are complemented by the measurement (red diamond) over the southern Galactic cap (fsky = 8.5%) by Ghosh et al. (2017) and that for the BICEP field (black square) after BICEP2 and Keck Array Collaborations (2016).
Current usage metrics show cumulative count of Article Views (full-text article views including HTML views, PDF and ePub downloads, according to the available data) and Abstracts Views on Vision4Press platform.
Data correspond to usage on the plateform after 2015. The current usage metrics is available 48-96 hours after online publication and is updated daily on week days.
Initial download of the metrics may take a while.