Open Access
Fig. B.5.
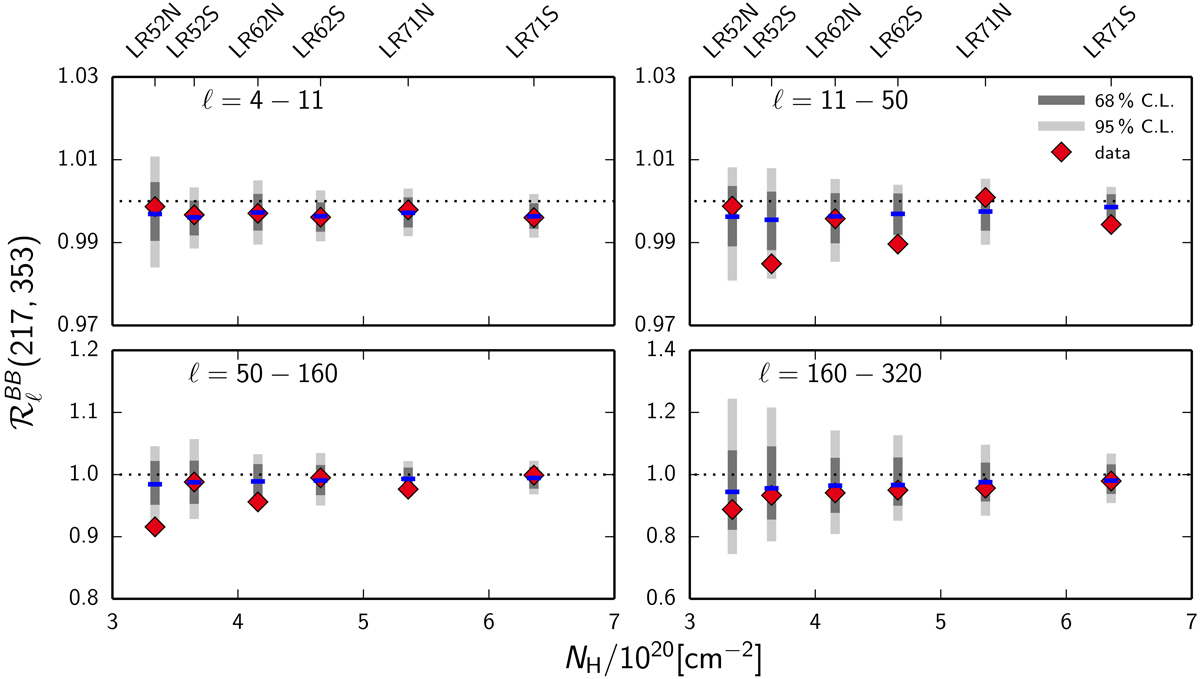
Spectral correlation ratio ![]() versus the mean hydrogen column density for northern and southern splits of three large sky regions. The dark and light grey bars represent the 68% and 95% intervals computed over the 300 E2E simulations, while the blue segments mark the median values.
versus the mean hydrogen column density for northern and southern splits of three large sky regions. The dark and light grey bars represent the 68% and 95% intervals computed over the 300 E2E simulations, while the blue segments mark the median values.
Current usage metrics show cumulative count of Article Views (full-text article views including HTML views, PDF and ePub downloads, according to the available data) and Abstracts Views on Vision4Press platform.
Data correspond to usage on the plateform after 2015. The current usage metrics is available 48-96 hours after online publication and is updated daily on week days.
Initial download of the metrics may take a while.