Fig. A.4.
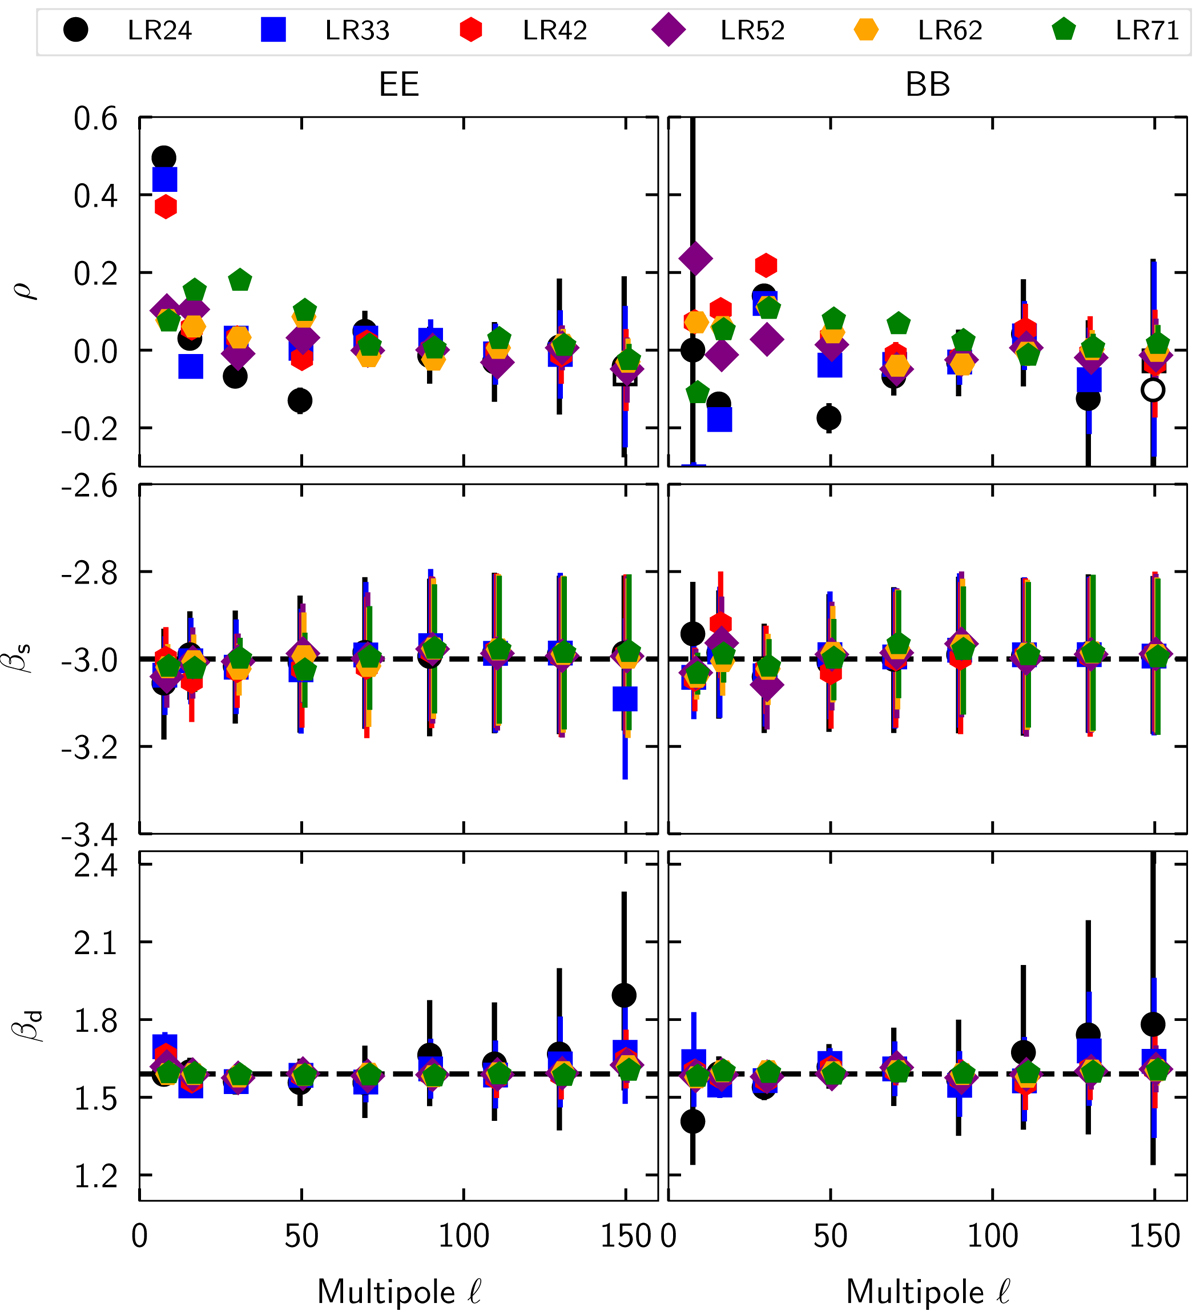
Results of the spectral fit to simulated data with uncertainties derived from the E2E simulated maps. Distinct symbols and colours represent the different sky regions (see top row). The dashed lines in plots of βs and βd are the input values of our sky model. We retrieve these input values without any bias. The sky model has a non-zero correlation between dust and synchrotron polarization at low ℓ, which is consistent with the value of ρ found by fitting the simulated data.
Current usage metrics show cumulative count of Article Views (full-text article views including HTML views, PDF and ePub downloads, according to the available data) and Abstracts Views on Vision4Press platform.
Data correspond to usage on the plateform after 2015. The current usage metrics is available 48-96 hours after online publication and is updated daily on week days.
Initial download of the metrics may take a while.