Fig. A.2.
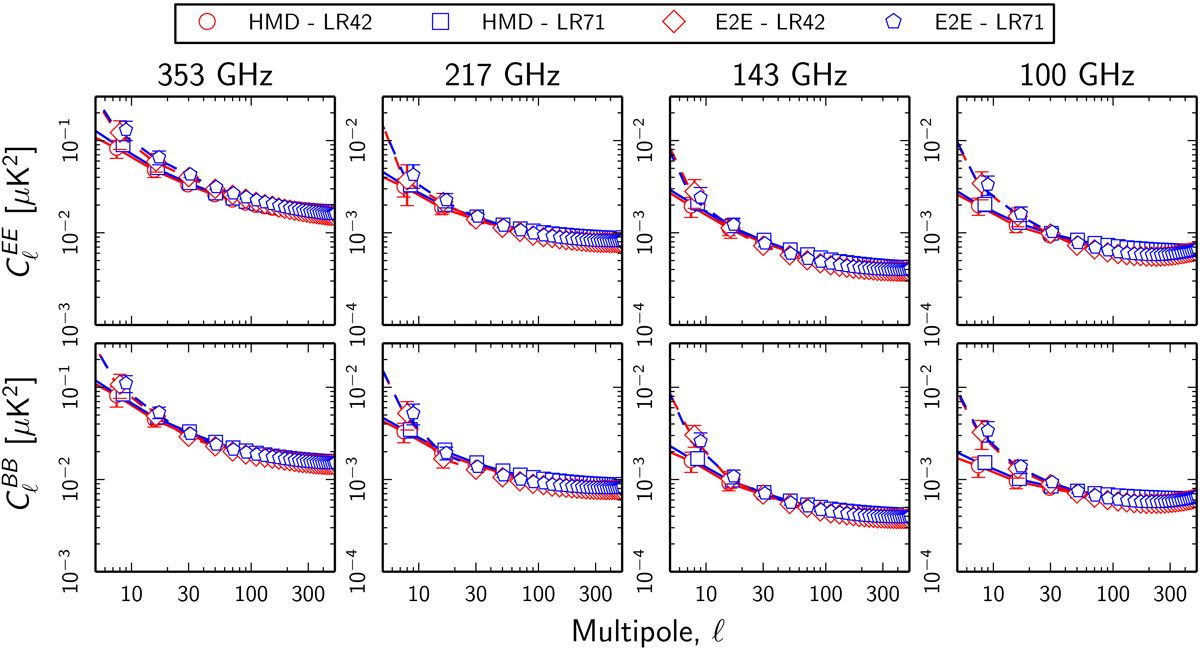
EE (left panels) and BB (right panels) power spectra from the HFI uncertainty maps described in Appendix A.1. The data points and error bars represent the mean and standard deviation of the power in each multipole bin computed over the 300 realizations for the LR42 (red) and LR71 (blue) sky regions. The dashed lines represent analytical fits (a power law plus a constant) to the data points. For comparison, the plots also present the spectra of the difference between half-mission maps (solid lines, labelled “HMD”).
Current usage metrics show cumulative count of Article Views (full-text article views including HTML views, PDF and ePub downloads, according to the available data) and Abstracts Views on Vision4Press platform.
Data correspond to usage on the plateform after 2015. The current usage metrics is available 48-96 hours after online publication and is updated daily on week days.
Initial download of the metrics may take a while.