Open Access
Fig. A.1.
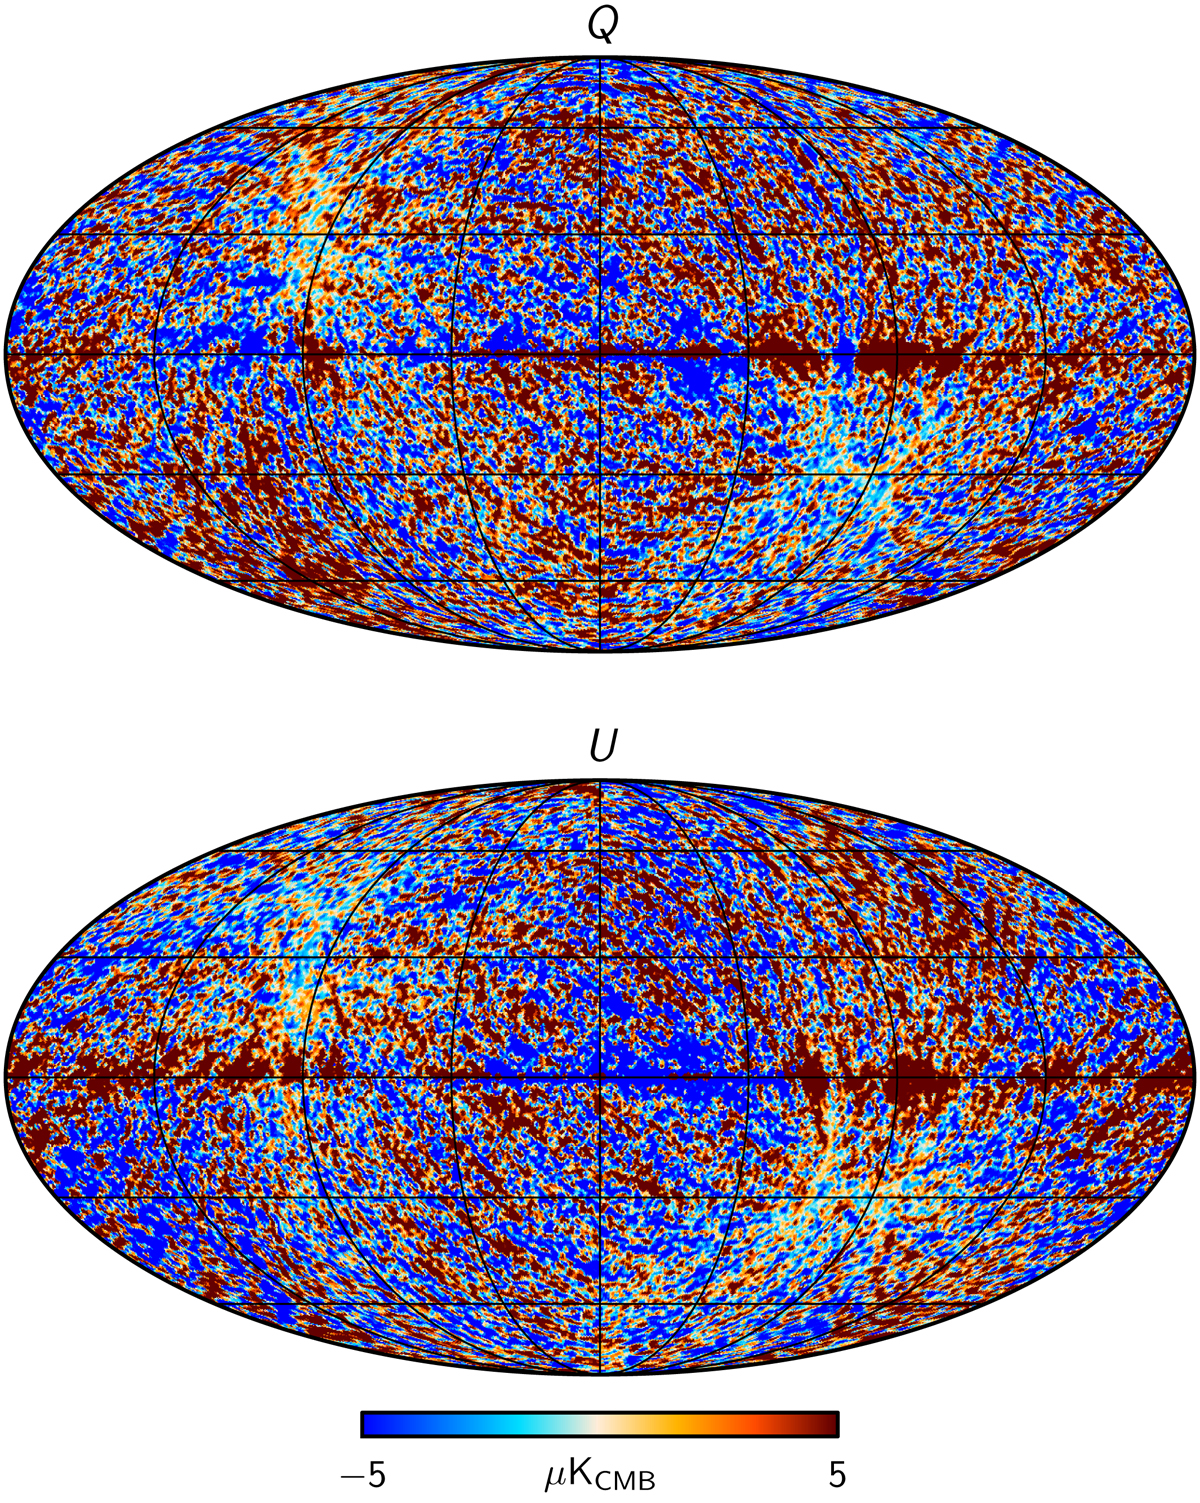
Difference between the Stokes Q and U output maps and the sky model inputs at 1° resolution, for one E2E simulation at 353 GHz. Such pairs of difference maps are used to quantify statistical and systematic uncertainties in our analysis of Planck HFI data.
Current usage metrics show cumulative count of Article Views (full-text article views including HTML views, PDF and ePub downloads, according to the available data) and Abstracts Views on Vision4Press platform.
Data correspond to usage on the plateform after 2015. The current usage metrics is available 48-96 hours after online publication and is updated daily on week days.
Initial download of the metrics may take a while.