Fig. 18.
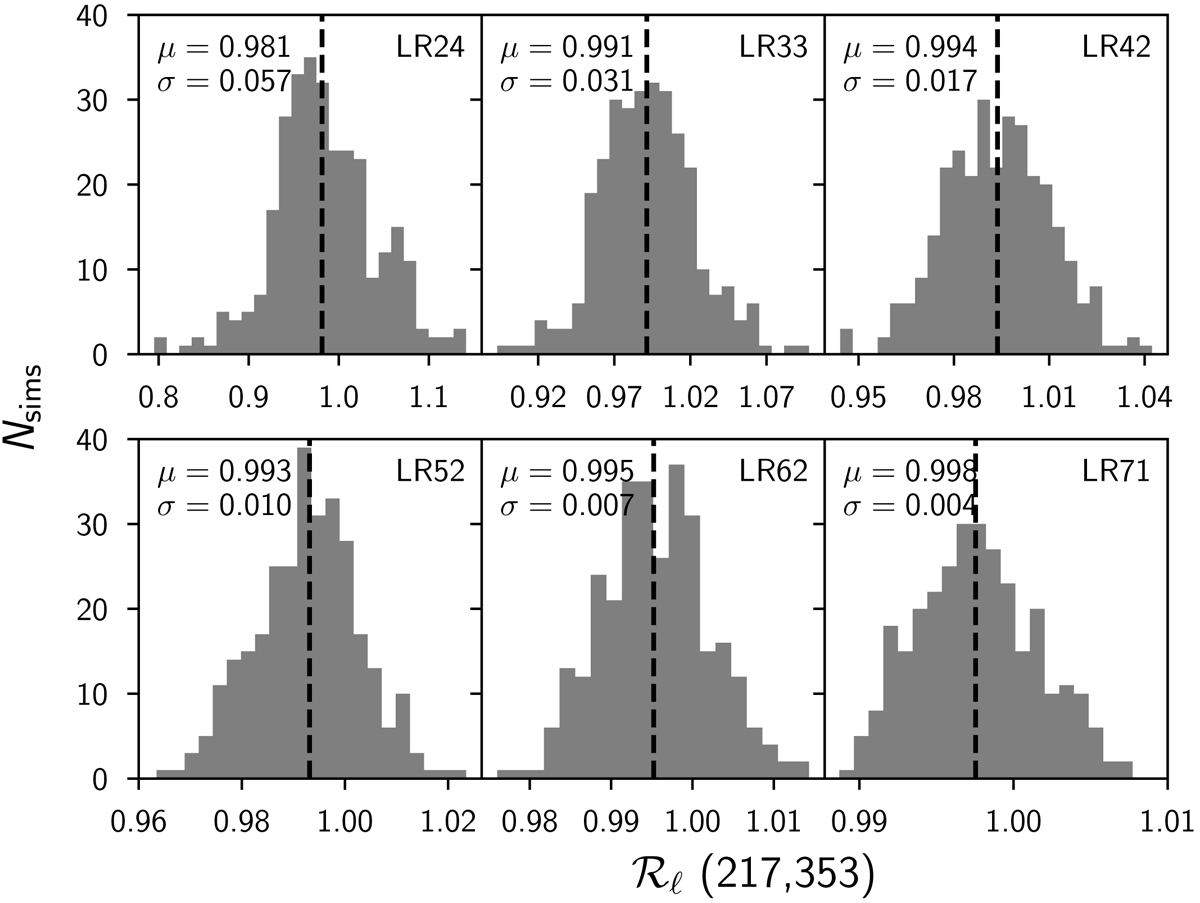
Distribution of the correlation ratios ![]() inferred from δd on the six sky regions for the ℓ range 50–160. The histograms are computed from the 300 E2E simulations using half-mission data splits. The dashed lines represent the median values on each sky region. This median value, μ, and the standard deviation, σ, are printed in the upper right of each panel. The lower limits on
inferred from δd on the six sky regions for the ℓ range 50–160. The histograms are computed from the 300 E2E simulations using half-mission data splits. The dashed lines represent the median values on each sky region. This median value, μ, and the standard deviation, σ, are printed in the upper right of each panel. The lower limits on ![]() in Table 5 are derived from the 2.5th percentile of the distribution for each sky region.
in Table 5 are derived from the 2.5th percentile of the distribution for each sky region.
Current usage metrics show cumulative count of Article Views (full-text article views including HTML views, PDF and ePub downloads, according to the available data) and Abstracts Views on Vision4Press platform.
Data correspond to usage on the plateform after 2015. The current usage metrics is available 48-96 hours after online publication and is updated daily on week days.
Initial download of the metrics may take a while.