Fig. 16.
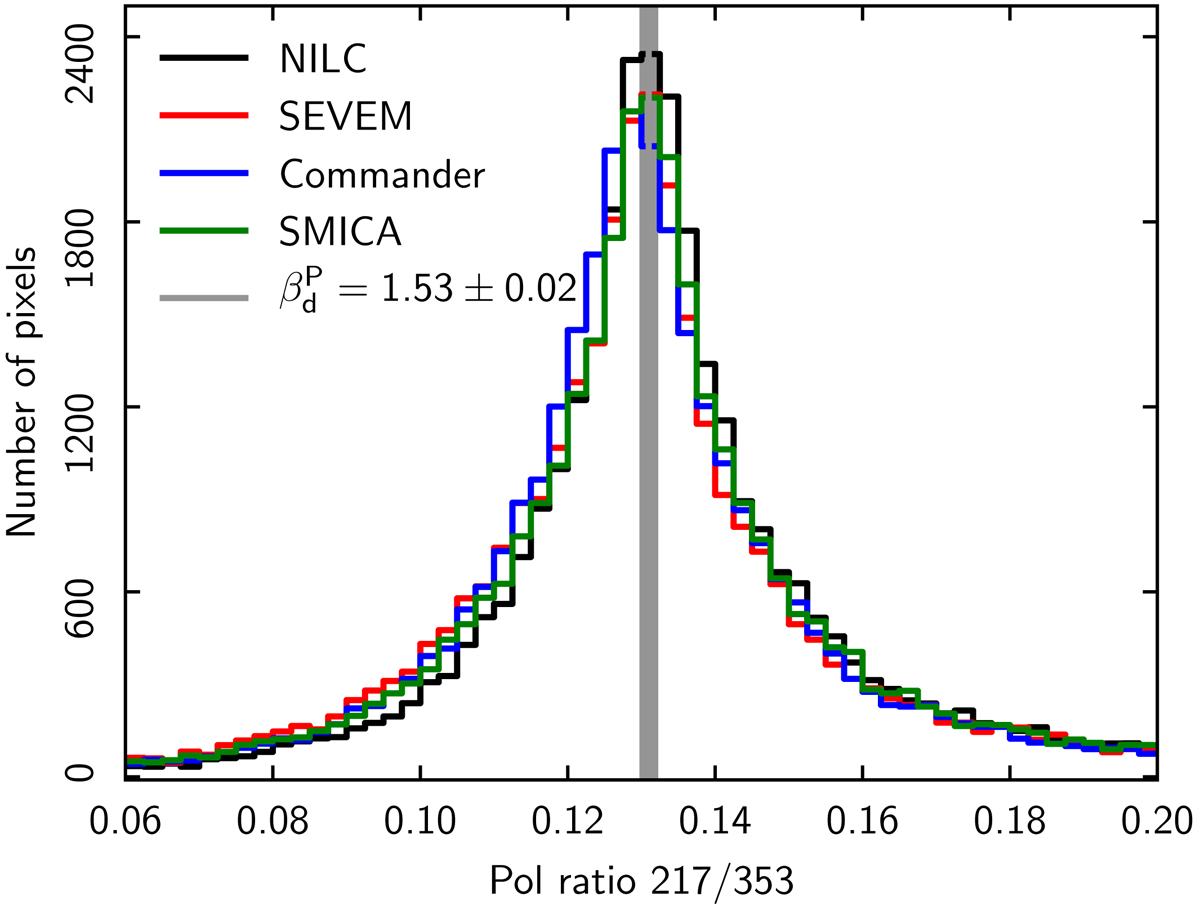
Illustration of the consistency between our analysis and component separation methods. The probability distribution of the 217–353 GHz colour ratio for dust polarized intensity, computed over the LR71 sky region from Planck CMB-subtracted maps smoothed to a 3° beam, is plotted for each of the component separation methods in Planck Collaboration IV (2020). The vertical line is the value derived from our analysis. For the unit conversion factors and color corrections, and our modification of the 217 GHz polarization efficiency, it corresponds to the spectral index ![]() from Sects. 5.1 and 5.2. The width of the line represents the error bar.
from Sects. 5.1 and 5.2. The width of the line represents the error bar.
Current usage metrics show cumulative count of Article Views (full-text article views including HTML views, PDF and ePub downloads, according to the available data) and Abstracts Views on Vision4Press platform.
Data correspond to usage on the plateform after 2015. The current usage metrics is available 48-96 hours after online publication and is updated daily on week days.
Initial download of the metrics may take a while.