Fig. 13.
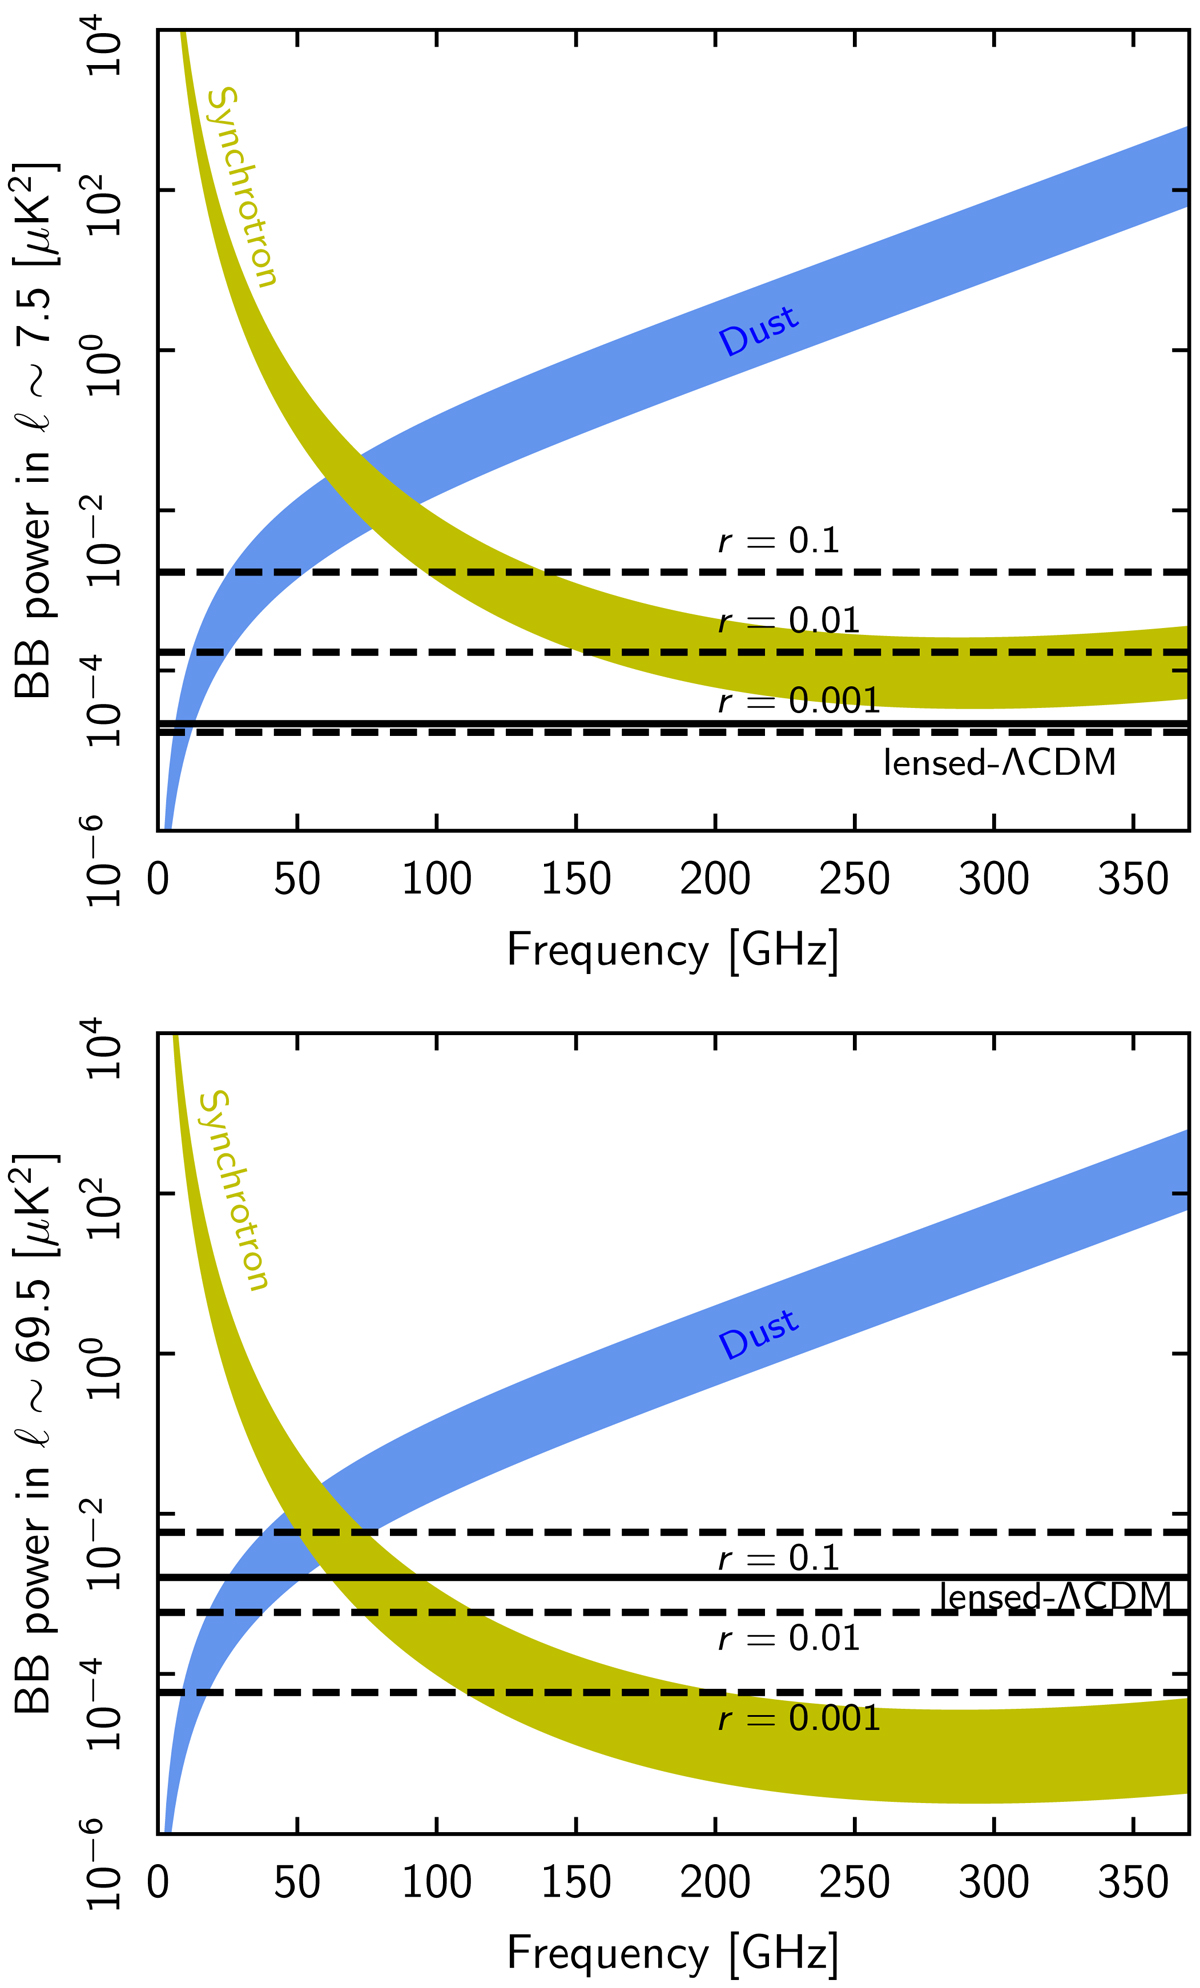
Dust and synchrotron B-mode power versus frequency for two multipole bins: ℓ = 4–11 (top) and 60–79 (bottom). The coloured bands show the range of power measured from the smallest (LR24) to the largest (LR71) sky regions in our analysis. The lower limit of the synchrotron band is derived from the S-PASS data analysis in Krachmalnicoff et al. (2018). The primordial CMB B-mode signal, averaged within the appropriate ℓ bin, is plotted with dashed lines for three values of the tensor-to-scalar ratio: r = 0.1; 10−2; and 10−3. The solid line represents the lensing B-mode signal for the Planck 2015 ΛCDM model (Planck Collaboration XIII 2016).
Current usage metrics show cumulative count of Article Views (full-text article views including HTML views, PDF and ePub downloads, according to the available data) and Abstracts Views on Vision4Press platform.
Data correspond to usage on the plateform after 2015. The current usage metrics is available 48-96 hours after online publication and is updated daily on week days.
Initial download of the metrics may take a while.