Fig. 11.
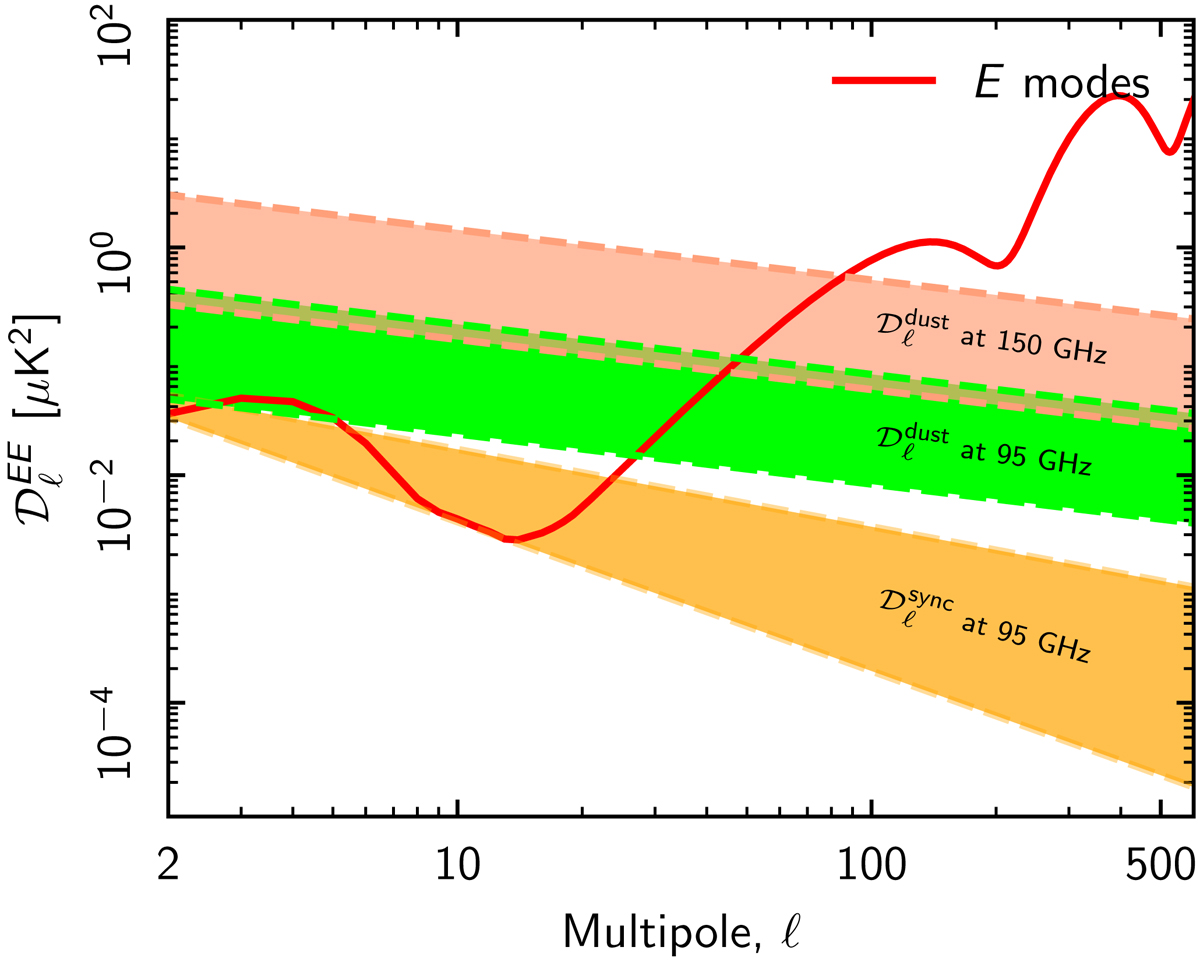
Dust and synchrotron E-mode power versus multipole. The dust power at 95 and 150 GHz and that of synchrotron at 95 GHz are compared with the CMB E-mode signal (red-line) computed for the Planck 2015 ΛCDM model (Planck Collaboration XIII 2016) and a Thompson scattering optical depth τ = 0.055 from Planck Collaboration Int. XLVI (2016). The coloured bands show the range of power measured from the smallest (LR24) to the largest (LR71) sky regions in our analysis. The lower limit of the synchrotron band is derived from the S-PASS data analysis in Krachmalnicoff et al. (2018).
Current usage metrics show cumulative count of Article Views (full-text article views including HTML views, PDF and ePub downloads, according to the available data) and Abstracts Views on Vision4Press platform.
Data correspond to usage on the plateform after 2015. The current usage metrics is available 48-96 hours after online publication and is updated daily on week days.
Initial download of the metrics may take a while.