Fig. 1.
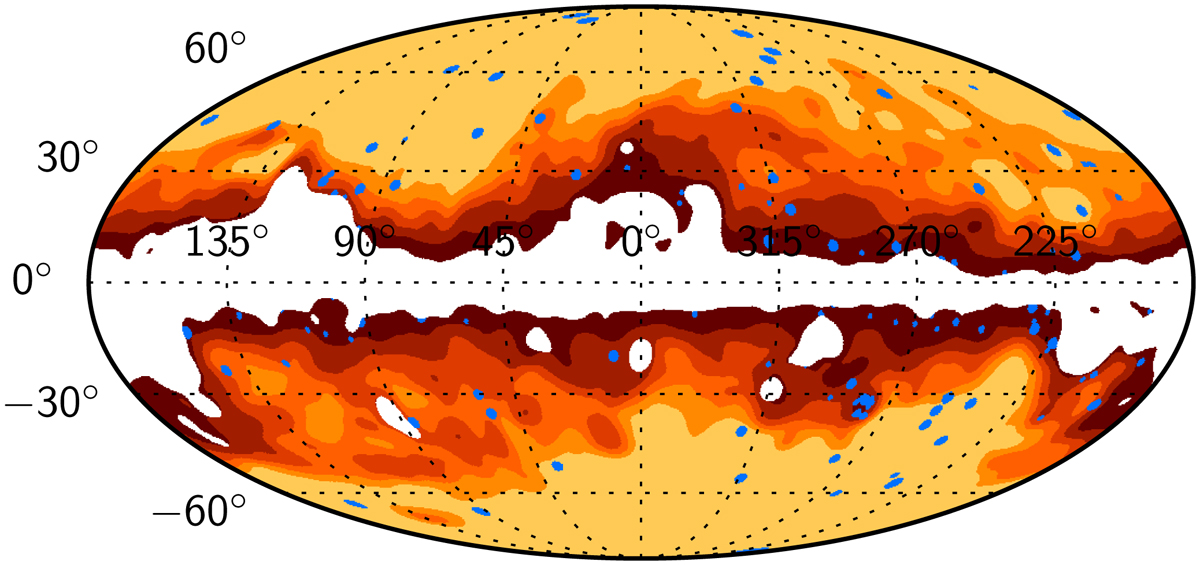
All-sky map showing the sky regions used to measure power spectra, indicated with colours varying from yellow to orange and dark-red. The white region represents the area where the CO line brightness is larger than 0.4 K km s−1, which is excluded from all the sky regions in our analysis. The blue dots represent the areas masked around point sources.
Current usage metrics show cumulative count of Article Views (full-text article views including HTML views, PDF and ePub downloads, according to the available data) and Abstracts Views on Vision4Press platform.
Data correspond to usage on the plateform after 2015. The current usage metrics is available 48-96 hours after online publication and is updated daily on week days.
Initial download of the metrics may take a while.