Fig. 1.
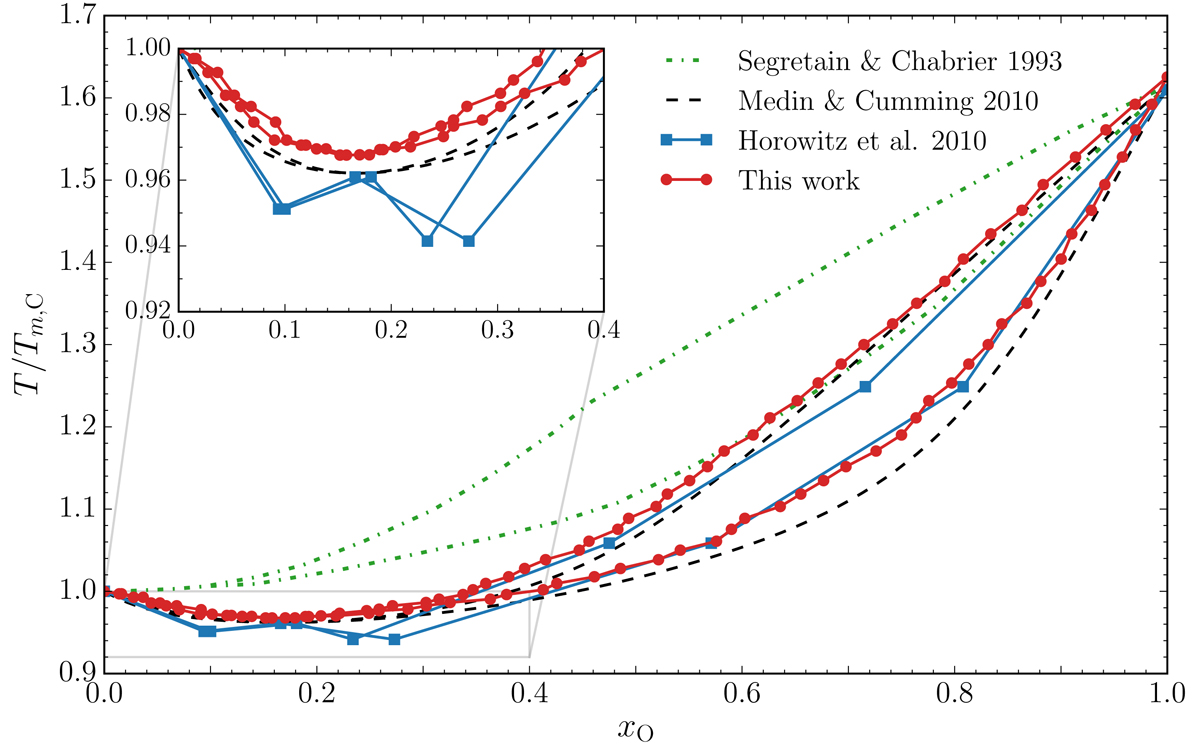
C/O phase diagram. The liquidus (above which the plasma is entirely liquid) and the solidus (below which it is entirely solid) are both shown. The horizontal axis gives the number fraction of O, xO = NO/(NC + NO), and the vertical axis corresponds to the ratio of the temperature to the melting temperature of a pure carbon plasma. The results from this work (in red) are compared to those of Segretain & Chabrier (1993), Medin & Cumming (2010), and Horowitz et al. (2010). The region where an azeotrope is predicted is enlarged in the upper left corner.
Current usage metrics show cumulative count of Article Views (full-text article views including HTML views, PDF and ePub downloads, according to the available data) and Abstracts Views on Vision4Press platform.
Data correspond to usage on the plateform after 2015. The current usage metrics is available 48-96 hours after online publication and is updated daily on week days.
Initial download of the metrics may take a while.